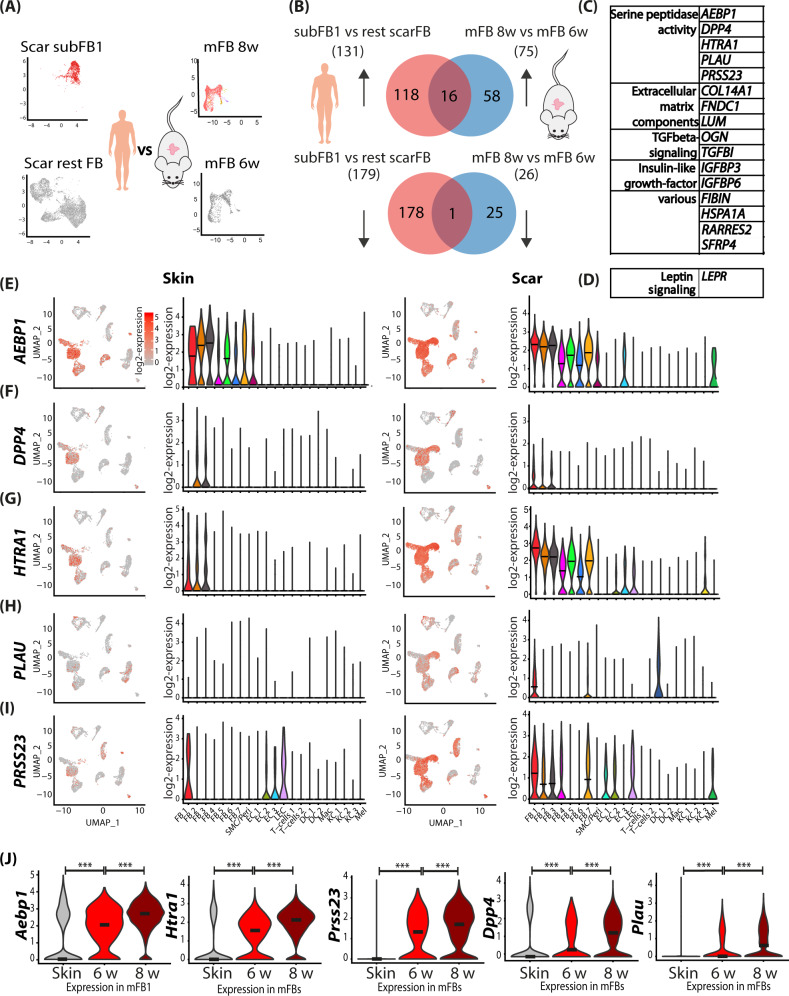
Fig. 5. Comparing human scar gene expression and mouse scar maturation identifies mutual drivers of skin fibrosis.
A Illustration of computational basis for comparison human and mouse. Human cluster subFB1 vs remaining scar FBs significantly (adj. p-value <0.05) regulated genes were compared with mouse scar FBs 8 weeks vs 6 weeks significantly regulated genes. B Venn diagrams of human and mouse up- (upper panel) and down- (lower panel) regulated genes. C Table of mouse and human mutually up and D downregulated genes. E–I Violin plots and feature plots of serine proteases in mouse skin and scars. Vertical lines in violin plots represent maximum expression, shape of each violin represents all results, and width of each violin represents frequency of cells at the respective expression level. J Feature plots and violin plots of serine proteases in human skin and scar. AEBP1 (adipocyte enhancer-binding protein 1) (p = 2.22e−16, p = 2.22e−16), DPP4 (dipeptidyl-peptidase 4) (p = 6.8e−9, p = 1.1e−15), HTRA1 (high-temperature requirement A serine peptidase 1) (p = 2.22e−16, p = 2.22e−16), PLAU (urokinase) (p = 2.22e−16, p = 2.22e−16), PRSS23 (serine protease 23) (p = 2.22e−16, p = 4e−14). In violin plots, dots represent individual cells, y-axis represents log2 fold change of the normalized genes and log-transformed single-cell expression. Vertical lines in violin plots represent maximum expression, shape of each violin represents all results, and width of each violin represents frequency of cells at the respective expression level. In feature plots, normalized log expression of the respective gene is mapped onto the UMAP-plot. Color intensity indicates level of gene expressions. UMAP, uniform manifold approximation and projection. A two-sided Wilcoxon-signed rank test was used in R. NS p > 0.05, *p < 0.05, **p < 0.01, ***p < 0.001.

