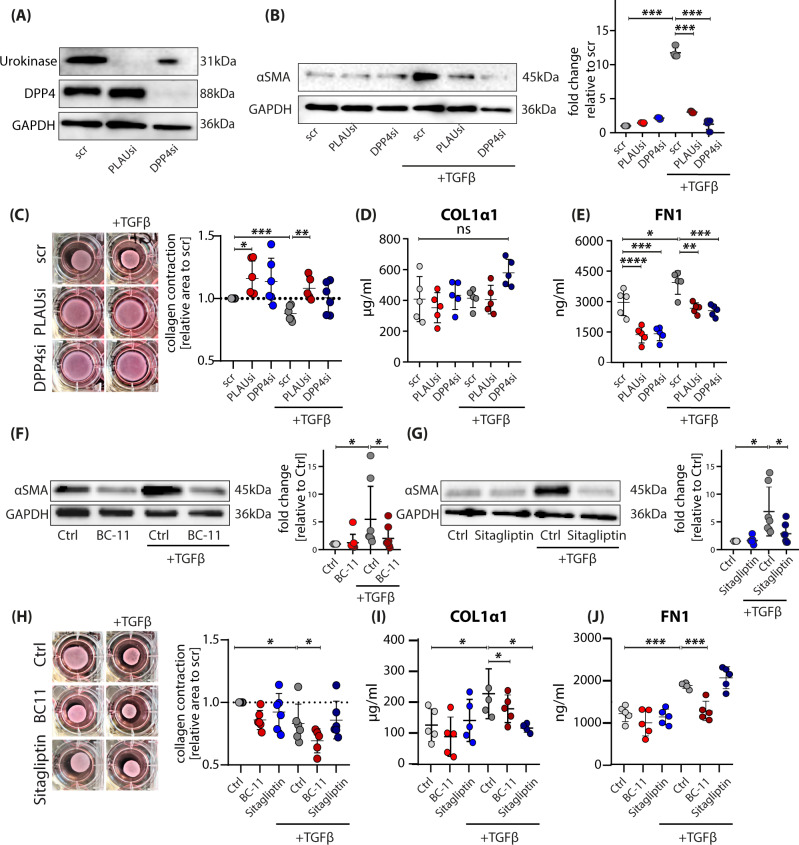
Fig. 7. Knockdown and pharmacological inhibition of DPP4 or urokinase prevents TGFβ-induced myofibroblast differentiation.
A, B Western blot of primary FBs after knockdown of PLAU or DPP4. B Western blot of primary FBs after knockdown of DPP4 or PLAU stimulated with active TGFβ1 for 24 h to differentiate FBs into alpha-smooth muscle actin-expressing (αSMA) myofibroblasts, and western blot quantification (n = 3). scr vs scr+TGFβ1, p = 0.0006; scr+TGFβ1 vs PLAUsi+TGFβ1 p = 0.0010; scr+TGFβ1 vs DPP4si + TGFβ1 p = 0.0017. C Collagen contractility with FBs after knockdown of PLAU or DPP4 and stimulation with or without active TGFβ1. scr vs PLAUsi p = 0.0194; scr vs scr+TGFβ1 p = 0.0005; scr+TGFβ1 vs PLAUsi+TGFβ1 = 0.0018. D Collagen I (p > 0.05) and E fibronectin (scr vs scr+TGFβ1, p = 0.0193; scr vs PLAUsi p < 0.0001; scr vs DPP4si p = 0.0001; scr+TGFβ1 vs PLAUsi + TGFβ1 = 0.0017; scr+TGFβ1 vs DPP4si + TGFβ1 = 0.0006) concentrations in supernatants of TGFβ1-stimulated primary skin FBs after knockdown with PLAU or DPP4. F, G Western blot of primary FBs stimulated with active TGFβ1 for 24 h to differentiate FBs into alpha-smooth muscle actin-expressing (αSMA) myofibroblasts, and quantification of western blot (n = 5–6). Myofibroblast differentiation inhibited with F urokinase inhibitor BC-11 (Ctrl vs Ctrl+TGFβ1 p = 0.049, Ctrl+TGFβ1 vs BC-11 + TGFβ1 p = 0.020) or G DPP4 inhibitor Sitagliptin (Ctrl vs Ctrl+TGFβ1 p = 0.0183, Ctrl+TGFβ1 vs Sitagliptin+TGFβ1 p = 0.0356). H Collagen contractility with FBs after inhibition with BC-11 or Sitagliptin and stimulation with or without active TGFβ1 (Ctrl vs Ctrl+TGFβ1 p = 0.024; Ctrl + TGFβ1 vs BC-11 + TGFβ1 p = 0.037). I Collagen I (Ctrl vs Ctrl+TGFβ1 p = 0.0465; Ctrl+TGFβ1 vs BC-11 + TGFβ1 p = 0.021) or J fibronectin (Ctrl vs Ctrl+TGFβ1 p = 0.0009; Ctrl vs Sitagliptin+TGFβ1 p = 0.0002) in supernatants of stimulated primary skin FBs, detected by enzyme-linked immunosorbent assay (ELISA). Quantification from western blot was calculated by pixel density measurement in ImageLab, adjusted to GAPDH and normalized to respective Ctrl values. Experiments were performed in duplicates of n = 5 each. Whiskers represent range maximum and minimum values with <1.5 interquartile range, boxes represent 25th–75th quartiles, line represents mean. Statistical significance was tested using two-way ANOVA with Tukey post-test. NS p > 0.05, *p < 0.05, **p < 0.01, ***p < 0.001. Source data are provided as a Source data file.

