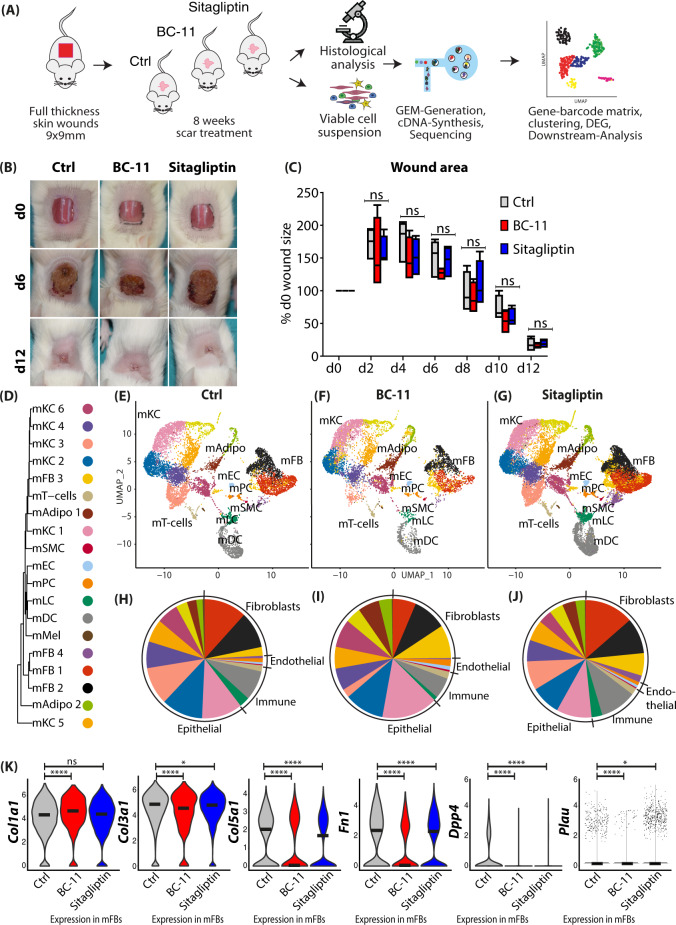
Fig. 8. In vivo application of BC-11 or Sitagliptin reduces expression of ECM and serine proteases.
A Workflow of mouse scarring and serine protease inhibitors. Biopsies of n = 4 mice per group were pooled for scRNAseq. B Images of wound healing in control or inhibitor-treated mice after 9, 6, and 12 days. C Quantification of wound area every second day after wounding. Four mice per group with three measurements per timepoint per mouse were analyzed. Wound area of d0 of every mouse was used as reference, and area was compared as percent of original wound size. Boxes indicate first and third quartile, whiskers indicate min and max, line indicates median. Statistical significance was tested using two-way ANOVA with Tukey post-test. D Phylogenetic clustertree calculated based on unsupervised UMAP-clustering. E–G UMAP-plots of mouse scar tissue, split by timepoint, after integration of all samples, identifying four fibroblast clusters (mFB1-4), smooth muscle cells and pericytes (mPC/SMC), endothelial cells and lymphatic endothelial cells (mEC/LEC), T cells, dendritic cells (mDC), Langerhans cells (mLC), nine keratinocyte clusters (KC1-9), adipocytes (mAdipo), and melanocytes (Mel). H–J Pie charts show relative numbers of cells in clusters, split by treatment. K Violin plots of ECM-associated genes. Col1a1 Ctrl vs BC-11 p = 4.8e−16, Ctrl vs Sitagliptin p = 0.3; Col3a1 Ctrl vs BC-11 p = 3.2e−12, Ctrl vs Sitagliptin p = 0.028; Col5a1 Ctrl vs BC-11 p = 1e−9, Ctrl vs Sitagliptin p = 1.4e−9; Fn1 Ctrl vs BC-11 p = 2.22e−16, Ctrl vs Sitagliptin p = 8.6e−5; Dpp4 Ctrl vs BC-11 p = 2.22e−16, Ctrl vs Sitagliptin p = 8.3e−11; Plau Ctrl vs BC-11 p = 5.04e−6, Ctrl vs Sitagliptin p = 0.022; vertical lines in violin plots represent maximum expression, shape of each violin represents all results, and width of each violin represents frequency of cells at the respective expression level. A two-sided Wilcoxon-signed rank test was used in R. UMAP, uniform manifold approximation and projection. NS p > 0.05, *p < 0.05, **p < 0.01, ***p < 0.001. using one-way ANOVA with Tukey post-test. NS p > 0.05, *p < 0.05, **p < 0.01, ***p < 0.001. Source data are provided as a Source data file.

