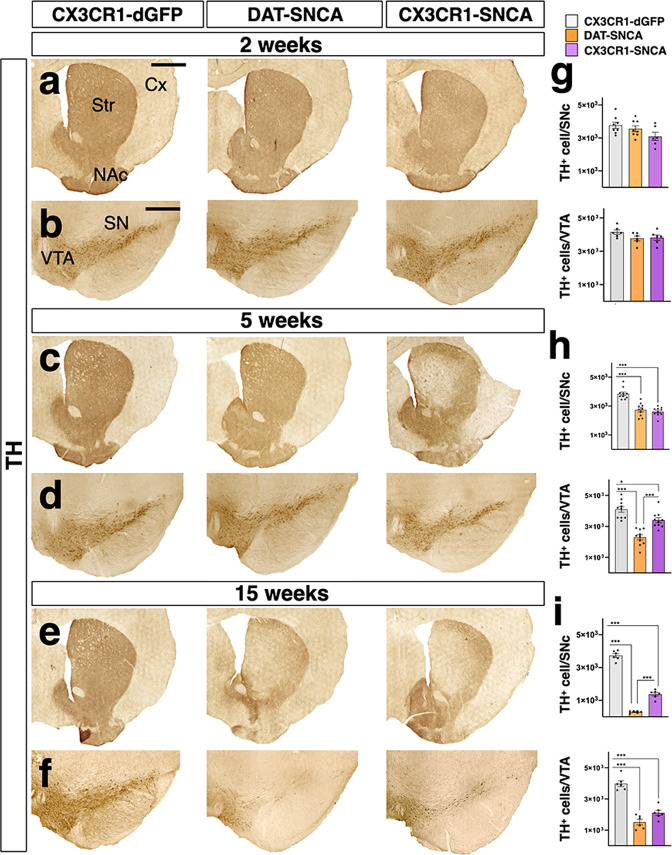
Fig. 3. Microglia-specific αSYN accumulation leads to severe DA neuronal degeneration in CX3CR1-SNCA mice.
a, c, e TH immunostaining in striatum shows a progressive loss of DA fibers over time after viral αSYN expression in DAT-SNCA and CX3CR1-SNCA animals at 2, 5, and 15 weeks. b, d, f–i The unbiased stereological count of TH+ neurons in the nigral tissue reveals significant neurodegeneration from 5 weeks onwards causing a 28% ± 1.2% and 32% ± 0.7% cell loss in DAT-SNCA and CX3CR1-SNCA mice, respectively. The neurodegeneration is progressive in both models reaching 92% ± 0.3% and 66% ± 1.2% of TH+ cell loss after 15 weeks in DAT-SNCA and CX3CR1-SNCA mice, respectively. The number of TH+ neurons in the VTA decreases over time, causing a 17% ± 1.2 and 44% ± 1.2 neuronal loss in CX3CR1-SNCA and DAT-SNCA animals, respectively. After 15 weeks we observe a further reduction reaching 47% ± 1.5 and 62% ± 1.6 in CX3CR1-SNCA and DAT-SNCA mice, respectively. Data are the mean ± s.e.m from n = 8 (CX3CR1-dGFP, DAT-SNCA), n = 6 (CX3CR1-SNCA) (g), n = 10 (h), n = 6 (i) nigral tissues. One-way ANOVA is followed by Bonferroni’s post-test. g Not significant differences for both SNc (F2, 19 = 2.714, p = 0.09) and VTA (F2, 15 = 2.106, p = 0.15). Panel h upper bar graph: ***p < 0.0001; p > 0.9 for (DAT-SNCA vs. CX3CR1-SNCA). Panel h lower graph: ***p < 0.0001 for (CX3CR1-dGFP vs. DAT-SNCA), ***p = 0.0002 for (DAT-SNCA vs. CX3CR1-SNCA) and *p = 0.022. i ***p < 0.0001. Scale bar, 500 µm. a, c, e 300 µm b, d, f The loss of TH positive cells is accompanied by the progressive reduction of TH positive fibers in the striatum of transduced mice. Cx cerebral cortex, NAc nucleus accumbens, SN substantia nigra, Str striatum, VTA ventral tegmental area.

