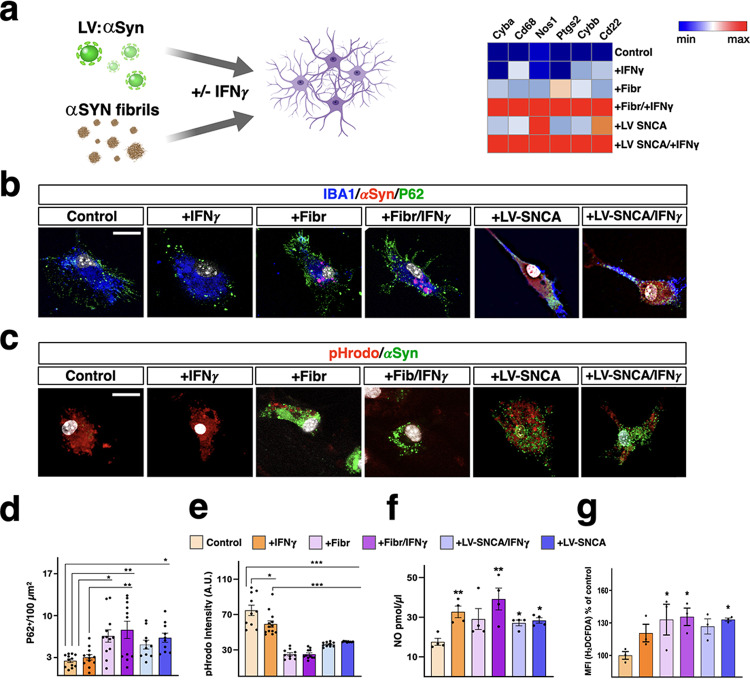
Fig. 6. αSYN and IFNγ provoke phagocytosis exhaustion in microglia.
a Either lentiviral αSYN gene expression or pre-formed αSYN fibrils elicit similar expression changes in key redox genes in primary microglia. b, d P62 Immunostaining (green) in microglia exposed to exogenous αSYN fibrils or expressing exogenous αSYN (red) with or without, IFNγ. Both αSYN fibrils and αSYN overexpression in presence of IFNγ provoke the accumulation of P62+ vesicles compared to control ±IFNγ. Data are the mean ± s.e.m. from n = 12 cells from two different experiments. *p = 0.013 (control vs. +Fibr), p = 0.043 (control vs. +LV-SNCA/ + IFNγ); **p = 0.001 (control vs. +IFNγ/+Fibr), p = 0.005 (+IFNγ vs. +INFγ/+Fibr). c, e Assessment of microglial phagocytosis by measuring the internalization of pHrodo labeled synaptosomes (red). The phagocytosis rate is scored by quantification of the intracellular pHrodo fluorescence intensity. Phagocytosis is impaired in microglia treated with mouse IFNγ and worsened in the presence of αSYN fibrils or αSYN overexpression (green). Data are the mean ± s.e.m from two independent experiments. ***p < 0.0001, *p = 0.007. Scale bar, 15 µm. f Nitric oxide (NO) extracellular release by microglia is increased by IFNγ, αSYN fibrils, and αSYN overexpression and further enhanced by αSYN fibrils and INFγ co-application. The extracellular NO level is assessed by fluorimetric analysis on the cell culture medium. Data are the mean ± s.e.m from n = 4 independent experiments. *p = 0.045 (control vs. +LV-SNCA), p = 0.024 (control vs. +LV-SNCA/ +IFNγ) and **p = 0.006 (control vs. +IFNγ), p = 0.001 (control vs. +IFNγ/+Fibr) g Intracellular ROS significantly increase in microglia exposed to αSYN fibrils with a further surge when IFNγ is co-applied. In αSYN overexpressing microglia, ROS levels reach a significant increase only in presence of IFNγ. Data are the mean ± s.e.m from n = 3 independent experiments. *p = 0.02 (control vs. +Fibr), p = 0.011 (control vs. +IFNγ/+Fibr) and p = 0.047 (control vs. +LV-SNCA). For detailed statistics see Supplementary Data 1.

