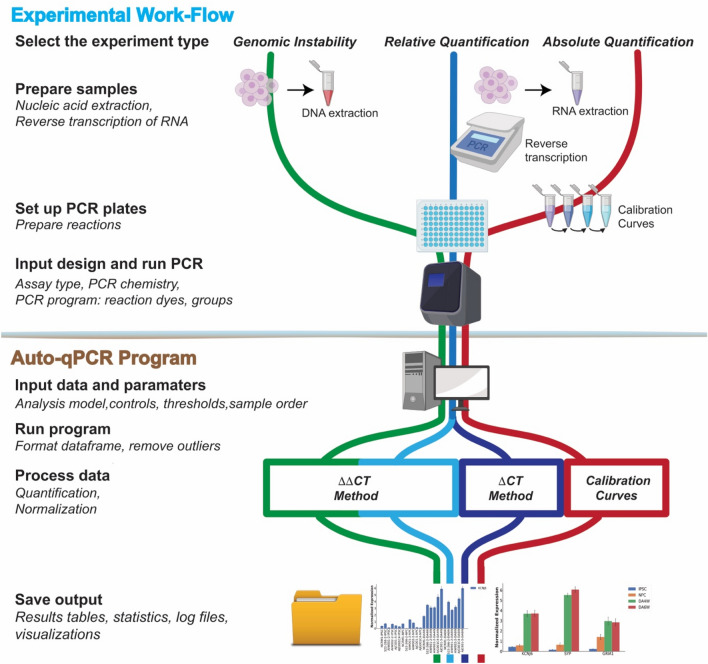
Figure 1.
Workflow of a qPCR experiment. Schematic representation of common qPCR assays: genomic stability assay to detect DNA deletions or duplication events (green line), two methods to quantify RNA (cDNA) using either absolute (red line) or relative quantification designs (blue lines). qPCR experiments can be sub divided in two parts: the sample preparation and running the PCR machine (Experimental Workflow) and the data analyses (Auto-qPCR Program). The preparation of the experiment includes nucleic acid extraction followed by a cDNA synthesis step (for RNA) and the in silico design of the PCR plate layout. Nucleic acid preparations are accurately diluted. For the absolute model, a standard curve must be created. The experimental design of the PCR plate, including the chemistry (fluorophore, primer mix), the status of the samples, and the transcripts or DNA region that are going to be amplified, must be generated in silico. After having defined the parameters of the qPCR reactions (number of PCR cycles and length of the different steps (denaturation, hybridization and elongation), and the temperatures), the PCR is run. The exported data from the thermocycler, converted to csv, is entered into the Auto-qPCR software and the model matching the experimental design and parameters for analysis are selected. The software will reformat the data, quantify each sample normalized to controls, and create spreadsheets and graphs to visualize the data analyses, all of which will be included in a zip file for the user to save.

