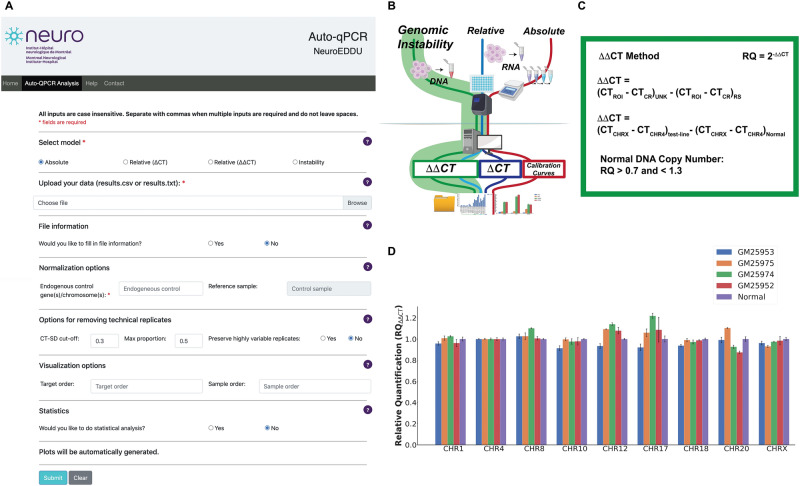
Figure 2.
Auto-qPCR can process PCR genomic stability data. (A) Screen capture of the Auto-qPCR web-app. (B) Simplified schematic of PCR workflow showing the genomic instability analysis in green. The DNA copy number is quantified with the same formula as the ΔΔ CT relative quantification model. (C) The calculations carried out for genomic instability testing (ΔΔ CT). Top, the general formula used where the CT values for each chromosome were normalized to a region of interest and then to a reference sample. Middle, the reference DNA region (CHR4) and the reference sample (Normal) used in this dataset. Bottom, the confidence interval for determining a genomic instability, insertion, or deletion event. (D) Bar chart showing the output from Auto-qPCR program running the genomic instability model. Four different iPSC cell lines are indicated and compared to the control sample. Normalized signals for all four cell lines are in the confidence interval defined by the control sample.

