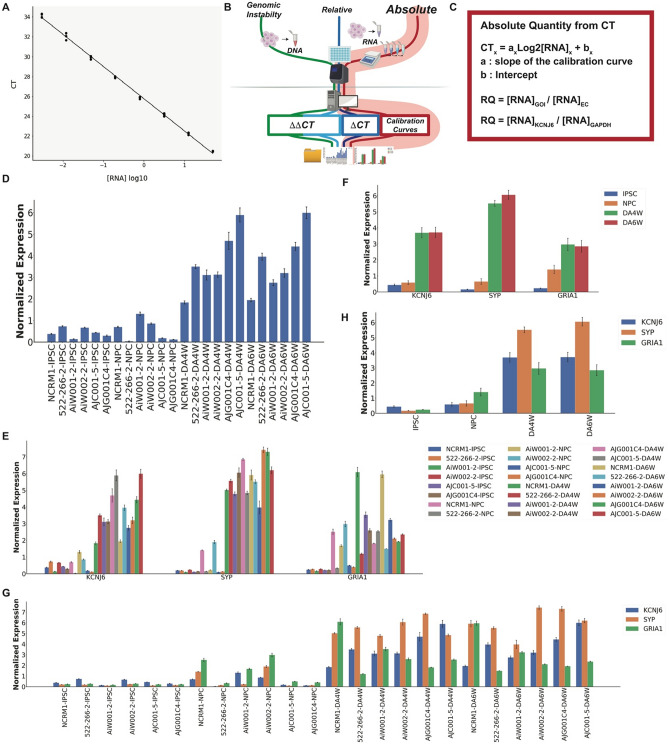
Figure 3.
Auto-qPCR can process quantitative qPCR data using a standard curve to perform statistical analysis. Output of Auto-qPCR processing using the absolute model. (A) Illustration of a calibration curve displaying 8 serial dilution points of a four-fold dilution which covers cDNA quantities from 0.003053 to 50 ng and establishes the linear relationship between CT values (y-axis) and the log2[RNA]. (B) Schematic of PCR workflow showing the pipeline for the absolute quantification using a standard curve in red. (C) Formula used to process a real-time PCR experiment using an absolute quantification design. Top, general formula where the linear relation between the logarithm of RNA concentration and the CT value is provided by the calibration curve. The normalized quantification is expressed as a ratio between concentrations for the gene of interest and the endogenous control(s) estimated from their respective calibration curves. Bottom, the variables specific to this dataset are shown in the general formula. (D) Bar chart showing the output from Auto-qPCR program using the absolute model for the normalized expression of the gene KCNJ6 for six cell lines at four different developmental stages (iPSC, induced pluripotent stem cells; NPC, Neural progenitor cells; DA4W, dopaminergic neurons at 4 weeks, DA6W: Dopaminergic neurons at 6 weeks). (E,G) Bar charts showing the average expression levels obtained from the three technical replicates for each cell line and time point for the three genes (SYP, KCNJ6 and GRIA1), normalized with two housekeeping genes (ACTB: beta-actin, GAPDH). (E) Mean RNA expression grouped by genes on the x-axis, cell lines and time points are indicated in legend. (G) Mean RNA expression grouped by cell lines and time points; the gene transcripts quantified are indicated in the legend. (F,H) Bar charts showing the mean expression levels of SYP, KCNJ6 and GRIA1 for four developmental stages (n = 6 cell lines). (F) Grouped by genes (x-axis), time points are indicated in the legend. (H) Grouped by time points (x-axis), the genes are indicated in the legend. One-way ANOVAs across differentiation stages for KCNJ6, SYP and GRIA1 (p < 0.001, p < 0.001, p = 0.002).

