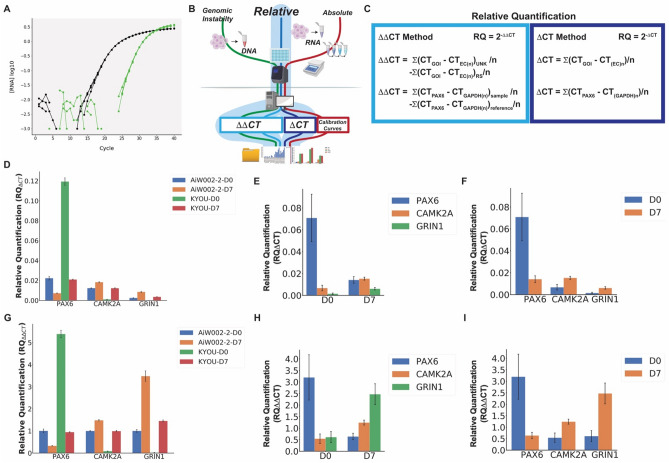
Figure 4.
Auto-qPCR can process quantitative PCR data using two different relative models. Output of Auto-qPCR using the relative quantification with both the ∆CT and ∆∆CT models. (A) Amplification curves illustrating a difference of cycle threshold values (∆CT) between a gene of interest and an endogenous control. (B) Schematic of PCR workflow showing the two methods to calculate relative RNA quantity, ∆CT in dark blue and ∆∆CT in light blue. (C) Formula used to perform a qPCR using relative quantification models, according the ∆CT (right), or the ∆∆CT methods (left). (D–F) Bar charts showing the output of the delta-CT model (RQ∆CT). (G–I) Bar charts showing the output from the ΔΔ-CT model (RQ∆∆CT). (D) and (G) Mean normalized gene expression values from technical replicates for the genes PAX6, CAMK2A and GRIN1 indicated on the x-axis for 2 cell lines at two stages of differentiation (D0: Neural progenitor cells, and D7: cortical neurons at 7 days of differentiation) as indicated. (E,H) Statistics output showing the mean gene expression from two cell lines at two stages of differentiation indicated, for the three genes indicated on the x-axis. (F,I) Statistics output showing the mean expression values for two cell lines at two time points on the x-axis and the three genes indicated. Differential expression between D0 and D7 is not significant (PAX6 p = 0.40, CAMK2A p = 0.18, GRIN1 p = 0.16), t tests, n = 2.

