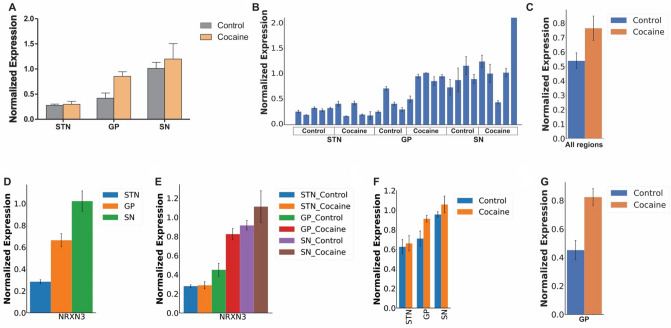
Figure 5.
Auto-qPCR can process data from different thermocyclers and produce the same results as manual processing. (A) Bar chart showing the mean Nrxn3 expression level normalized to B2M levels assessed with an absolute quantification design manually processed and plotted in Prism, grouped by brain regions (STN: subthalamic nucleus, GP: globus paladus, SN: substantia nigra) on the x-axis, with and without cocaine treatment. (B) Output of Auto-qPCR processing the same dataset. Nrxn3 normalized expression levels from technical replicates for each biological sample. The treatment conditions are indicated below the x-axis. (C) Statistics output of Auto-qPCR program comparing cocaine and control groups. Nrxn3 normalized expression levels in the combined brain regions. Expression is not significantly different, p = 0.113, t test, n = 13. (D) Auto-qPCR statistical output showing mean Nrxn3 expression combining treatments and comparing the three brain regions. One-way ANOVA shows significant effect of brain regions, FDR adjusted p < 0.001, n = 9 for GP and SN, n = 10 STN. (E) Bar chart of Nrxn3 expression shown as six groups distinguished by brain region and treatment generated by Auto-qPCR program after a one-way ANOVA, p < 0.001, n = 4 or 5. Post hoc analysis using multiple t test with FDR correction comparing treatment at each brain region: SNT p = 0.990, GP p = 0.033, SN p = 0.413. (F) Bar chart of Nrxn3 average normalized by brain region (x-axis) and treatment, generated by Auto-qPCR program after a two-way ANOVA, brain region p < 0.001, treatment p = 0.2265, n = 4 or 5. Post hoc analysis using multiple t test with FDR correction comparing each brain region with and without cocaine: SNT p = 0.0.998, GP p = 0.053 and p-unadjusted = 0.017, SN p = 0.619 (G) Bar chart of the average Nrxn3 normalized expression levels in the GP compared between the two groups with a t test (p = 0.0176).

