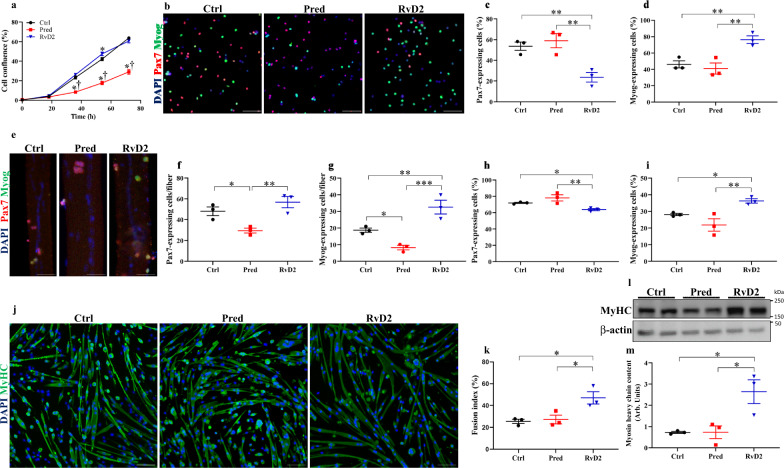
Fig. 2. Resolvin-D2 directly targets myogenic cells and stimulates their myogenesis capacity.
a Primary myoblasts isolated from mdx mice were plated in vitro in an automated live imaging analysis system (IncuCyte). Cells were cultured in proliferation media supplemented with Resolvin-D2 (RvD2, 200 nM, blue triangles), prednisone (pred, 10 μM, red squares), or vehicle (Ctrl, black circles), and cell confluence was assessed for 3 days (36 h: Ctrl vs. Pred, p < 0.0001; Ctrl vs. RvD2, p = 0.1352; Pred vs. RvD2, p < 0.0001; 54 h: Ctrl vs. Pred, p < 0.0001; Ctrl vs. RvD2, p = 0.0084; Pred vs. RvD2, p < 0.0001; 72 h: Ctrl vs. Pred, p < 0.0001; Ctrl vs. RvD2, p = 0.1089; Pred vs. RvD2, p < 0.0001). b–d Dystrophin-deficient myoblasts were cultured in low serum medium for 16 h supplemented with RvD2, prednisone, or vehicle. b Representative images of immunofluorescence for Pax7 (red) and Myog (green). Scale bars = 100 μm. c, d Quantification of the proportion of Pax7-expressing cells (MuSC/proliferative myoblasts) (Ctrl vs. Pred, p = 0.4995; Ctrl vs. RvD2, p = 0.0070; Pred vs. RvD2, p = 0.0032) and Myog-expressing cells (differentiated myoblasts) (Ctrl vs. Pred, p = 0.5243; Ctrl vs. RvD2, p = 0.0074; Pred vs. RvD2, p = 0.0035). e–i Single myofibers were isolated from the EDL muscle of mdx mice and cultured for 72 h with RvD2 (200 nM), prednisone (10 μM), or vehicle (n = 30 fibers/biological sample). e Representative images of myofibers immunostained for Pax7 (red), Myog (green), and DAPI (blue). Scale bars = 50 μm. f, g Quantification of the total number of Pax7+ (Ctrl vs. Pred, p = 0.0204; Ctrl vs. RvD2, p = 0.1893; Pred vs. RvD2, p = 0.0037) cells and Myog+ (Ctrl vs. Pred, p = 0.03; Ctrl vs. RvD2, p = 0.0098; Pred vs. RvD2, p = 0.0006) cells per fiber. h, i Proportion of pax7-expressing and myogenin-expressing cells (Ctrl vs. Pred, p = 0.1040; Ctrl vs. RvD2, p = 0.0466; Pred vs. RvD2, p = 0.0045) relative to the total number of myogenic cells (Pax7+ and Myog+). j, k Dystrophin-deficient myoblasts were differentiated for 4 days in low serum medium supplemented with RvD2, prednisone, or vehicle. j Representative images of myotubes immunostained for MyHC (green) and DAPI (blue). Scale bars = 75 μm. k Quantification of the fusion index (proportion of nuclei into multinucleated myotubes/total nuclei) (Ctrl vs. Pred, p = 0.7713; Ctrl vs. RvD2, p = 0.0101; Pred vs. RvD2, p = 0.0146). l Representative images and m quantification of myosin heavy chain expression by Western blot in myotubes (relative to β-actin as loading control) (Ctrl vs. Pred, p = 0.9899; Ctrl vs. RvD2, p = 0.0102; Pred vs. RvD2, p = 0.0103). The samples derive from the same experiment and the gels/blots were processed in parallel. a, c, d, f–i, k, m RvD2 = blue triangles, pred = red squares or Ctrl = black circles. Data are presented as mean ± SEM, n = 3 biologically independent samples performed in technical duplicates and analyzed with one-way ANOVA uncorrected Fisher’s LSD test. All data were analyzed with a 95% confidence interval. *p < 0.05 compared with the vehicle and † p < 0.05 compared with prednisone for panel (a). *p < 0.05, **p < 0.01, ***p < 0.001 for c, d, f–i, k, and m.

