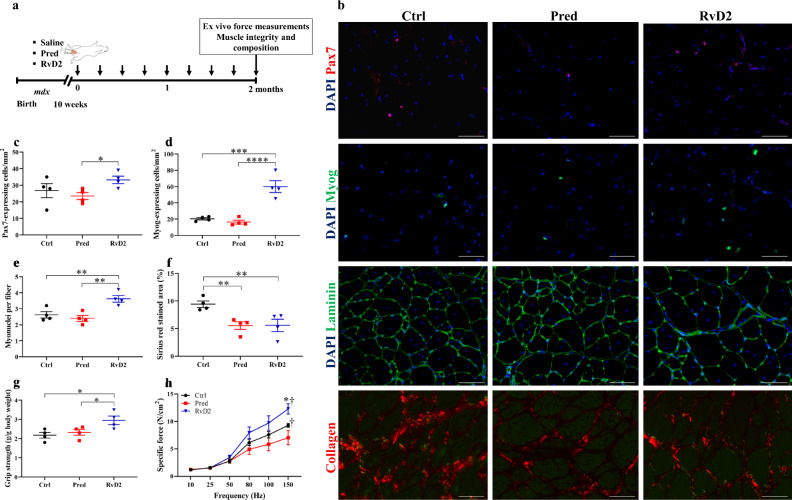
Fig. 7. The superior therapeutic effect of RvD2 is maintained at long term in mdx mice.
a Timeline of weekly ip injection of either RvD2 (5 μg/kg), prednisone (pred, 2 mg/kg), or vehicle (ctrl) into mdx mice for 2 months. b Representative images of Pax7 (red), Myog (green), laminin (green), DAPI (blue), or collagen (red) immunohistological staining in muscle section of tibialis anterior (TA) muscle (for Pax7, Myog, laminin) or diaphragm muscle (for collagen staining) of treated mdx mice. Scale bars = 50 μm. c, d Quantification of total number of Pax7+ cells (c) (Ctrl vs. Pred, p = 0.4663; Ctrl vs. RvD2, p = 0.1625; Pred vs. RvD2, p = 0.0484) and Myog+ differentiated myoblasts (d) (Ctrl vs. Pred, p = 0.5438; Ctrl vs. RvD2, p = 0.0001; Pred vs. RvD2, p < 0.0001) in TA muscles of mdx mice treated for 2 months. e Number of myonuclei per fiber in TA muscles of mdx mice treated for 2 months (Ctrl vs. Pred, p = 0.4460; Ctrl vs. RvD2, p = 0.0063; Pred vs. RvD2, p = 0.0019). f Quantification of Sirius red positive area (collagen) in diaphragm muscles of mdx mice treated for 2 months (Ctrl vs. Pred, p = 0.0089; Ctrl vs. RvD2, p = 0.0092; Pred vs. RvD2, p = 0.9834). g Grip strength measured in treated mdx mice after 7 weeks of treatment (Ctrl vs. Pred, p = 0.5667; Ctrl vs. RvD2, p = 0.0133; Pred vs. RvD2, p = 0.0351). h Specific muscle force (N/cm2) of EDL muscles of mdx mice treated for 2 months (150 Hz: Ctrl vs. Pred, p = 0.0298; Ctrl vs. RvD2, p = 0.0048; Pred vs. RvD2, p < 0.0001). c–h RvD2 = blue triangles, pred = red squares or Ctrl = black circles. Data are presented as mean ± SEM, n = 4 (except n = 3 for h) mice per group. Experiments were performed in technical duplicates using one-way (c–g) or two-way (h) ANOVA uncorrected Fisher’s LSD test. All data were analyzed with a 95% confidence interval. *p < 0.05; **p < 0.01; ***p < 0.001; ****p < 0.0001 for c–g. *p < 0.05 compared with the vehicle; †p < 0.05 compared with prednisone for h.

