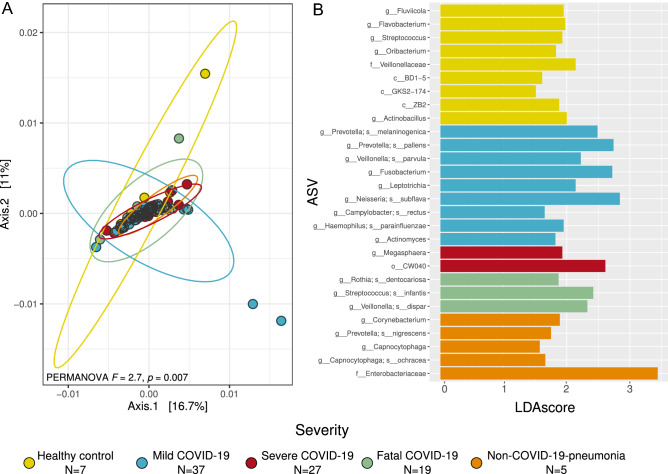
Figure 3.
Beta diversity of the respiratory microbiota between patients with different severity levels of COVID-19 and controls. (A) Principal Coordinates Analysis (PCoA) with weighted Unifrac distance and PERMANOVA result that test differences in the community arrange between groups. Each color represents an analyzed group specified in the legend. (B) Differentially abundant taxa for each group obtained through LefSe analysis. Only features with a LDA score higher than 1.5 and a p < 0.01 were included. ASV Amplicon Sequence Variant.

