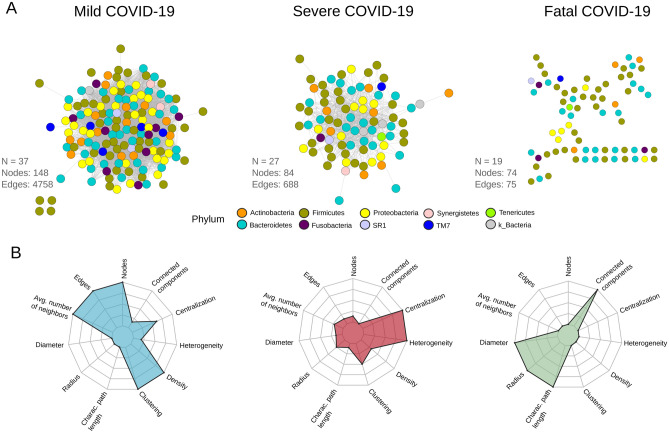
Figure 5.
Network structure of the respiratory microbiota between patients with different severity levels of COVID-19. (A) Co-occurrence/exclusion networks for patients with mild, severe and fatal COVID-19. Each node represents a microbial group at ASV level and each edge an interaction (either co-occurrence or co-exclusion). Colors denote phylum identity. Number of samples used to construct the network (N), number of nodes, and number of edges are reported in the figure. (B) Spider chart of the topological metrics associated to each network.

