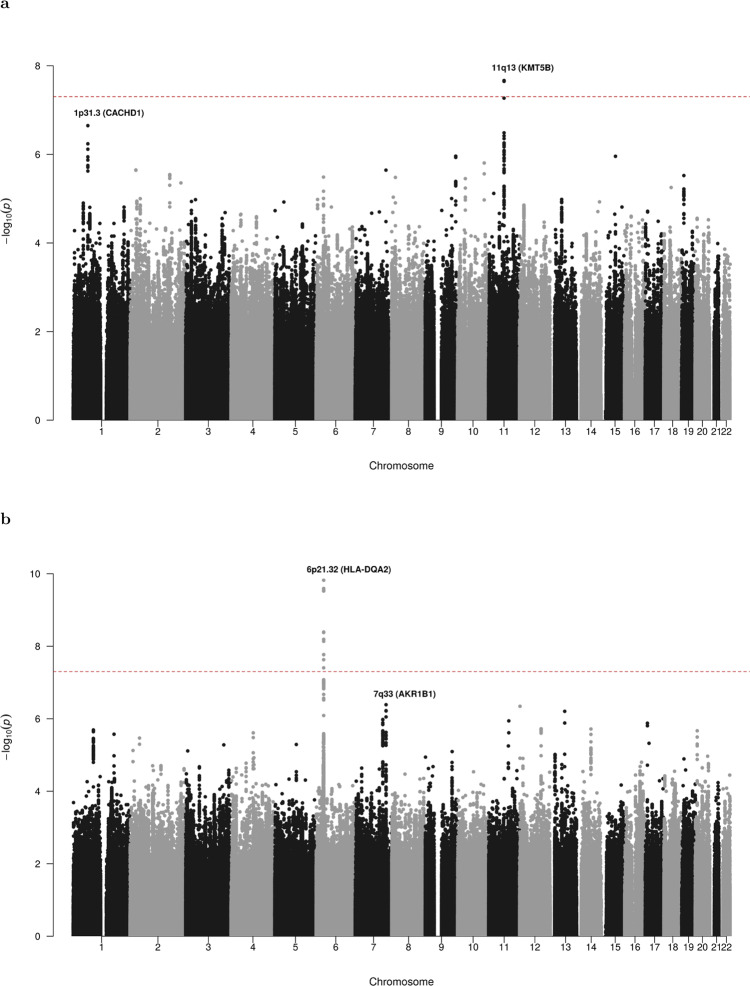
Fig. 1. Manhattan plots from acute myeloid leukemia meta-analysis of 4 genome-wide association studies.
For each GWAS, association tests were performed for all AML cases and cytogenetically normal AML assuming an additive genetic model, with nominally significant principal components included in the analysis as covariates. Association summary statistics were combined for variants common to all four GWAS, in fixed effects models using PLINK. Manhattan plots show negative log10 (fixed effects meta P values, Y axis) for all AML (a) and cytogenetically normal AML (b) over 22 autosomal chromosomes. Risk loci are annotated with chromosome position and local gene. All statistical tests were two-sided and no adjustments were made for multiple comparisons. The horizontal red line denotes the threshold for statistical significance in a genome-wide association study (P < 5.0 × 10⁻⁸).

