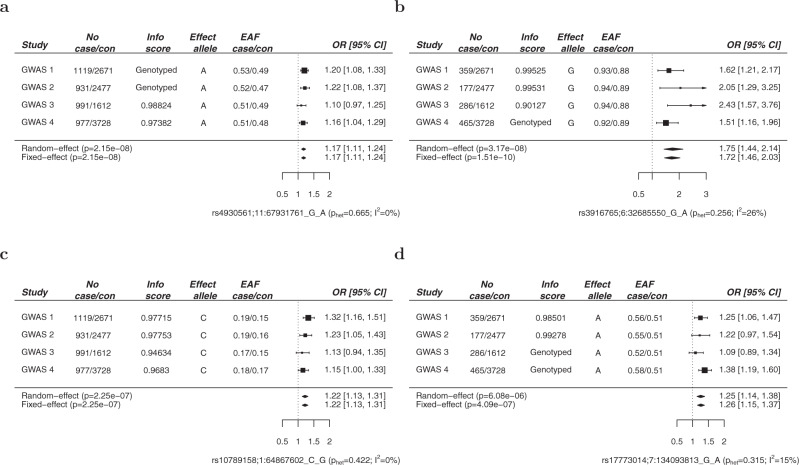
Fig. 2. Forest plots for 4 new loci associated with acute myeloid leukemia.
Study cohorts, sample sizes (case and controls (con)), imputation (info) score, effect allele, effect allele frequencies (EAF), and estimated odds ratios (OR) for rs4930561 (a), rs3916765 (b), rs10789158 (c), and rs17773014 (d). The vertical line corresponds to the null hypothesis (OR = 1). The horizontal lines and square brackets indicate 95% confidence intervals (95% CI). Areas of the boxes are proportional to the weight of the study. Diamonds represent combined estimates for fixed‐effect and random‐effect analysis. Cochran’s Q statistic was used to test for heterogeneity such that PHET > 0.05 indicates the presence of non-significant heterogeneity. The heterogeneity index, I2 (0–100) was also measured which quantifies the proportion of the total variation due to heterogeneity. All statistical tests were two-sided and no adjustments were made for multiple comparisons.

