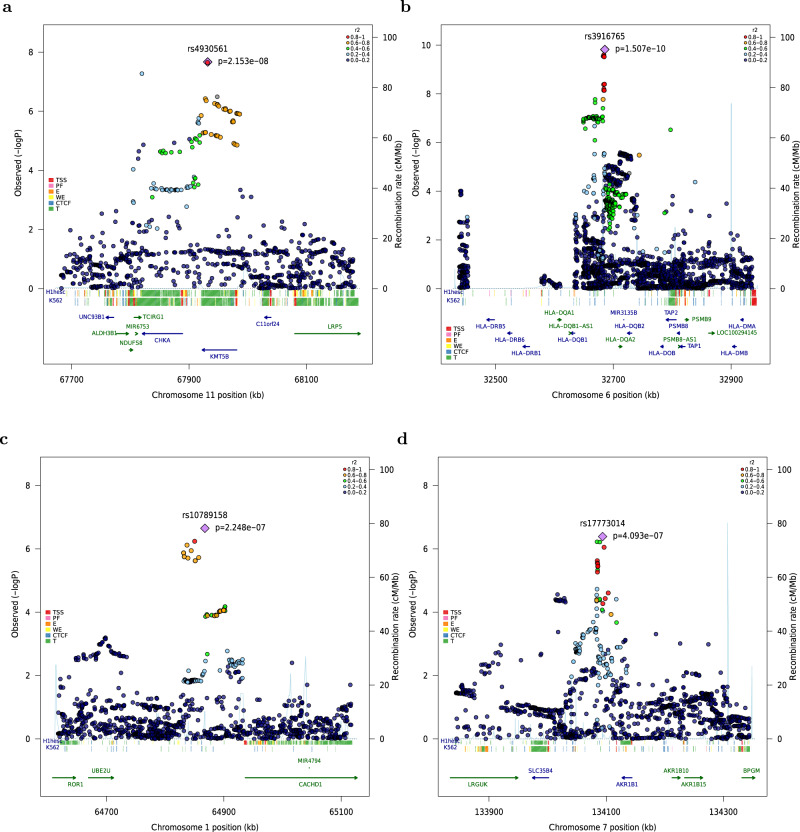
Fig. 3. Regional association and linkage disequilibrium plots for 4 new loci associated with acute myeloid leukemia.
For each GWAS, association tests were performed for all AML cases and cytogenetically normal AML assuming an additive genetic model, with nominally significant principal components included in the analysis as covariates. Association summary statistics were combined for variants common to all four GWAS, in fixed effects models using PLINK. Negative log10-transformed P values (left Y axis) from the meta-analysis of four GWAS are shown for SNPs at 11q13 (a) and 1p31.1 (c) for all AML irrespective of sub-type, and at 6p21.32 (b) and 7q33 (d) for cytogenetically normal AML. All statistical tests were two-sided and no adjustments were made for multiple comparisons. The lead SNP at each location is indicated by a purple diamond and the blue line shows recombination rate (right Y axis). All plotted SNPs were either directly genotyped or had an imputation score of >0.6 in all four GWAS datasets. Included are functional annotation tracks from ENCODE showing regulatory activity in H1 human embryonic stem cells (H1hesc) and K562 myeloid leukemia cells. TSS transcription start site, PF promoter flank, E enhancer, WE weak enhancer, CTCF CCCTC-binding factor site, T transcribed.

