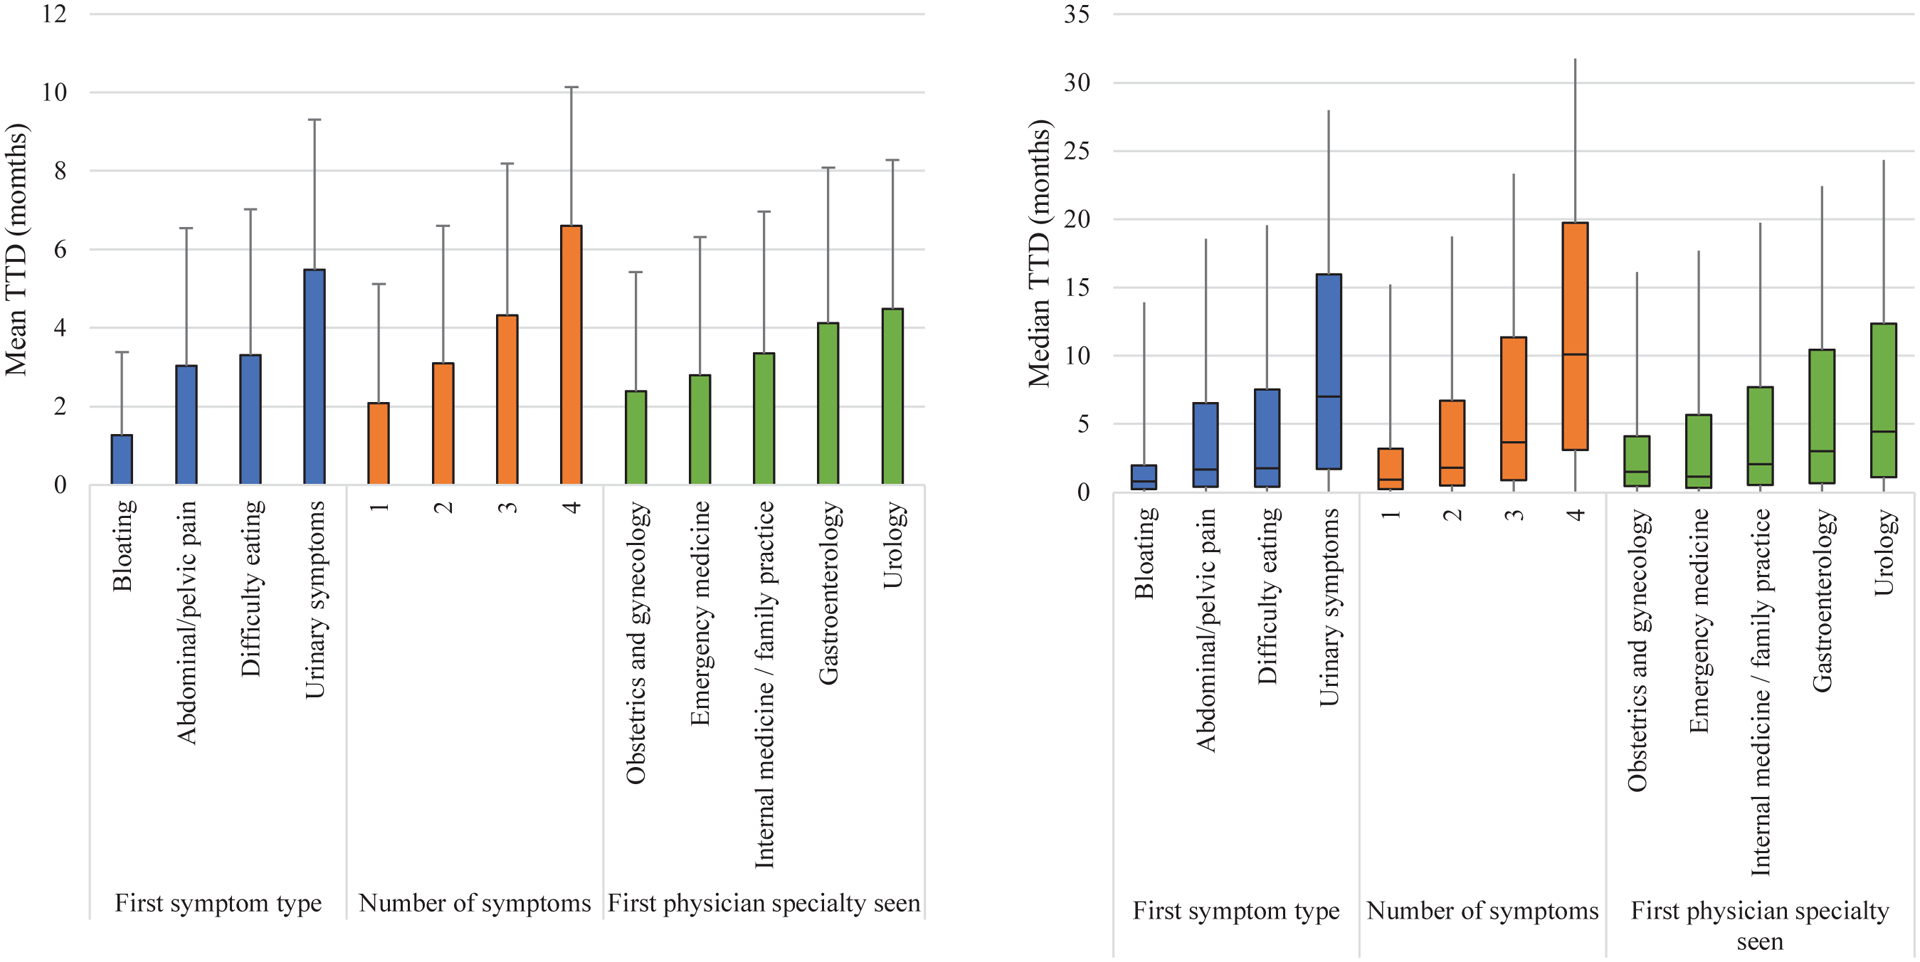
Figure 1. Mean and median TTD by first symptom, number of symptoms, and first physician specialty.

Left: Mean TTD is indicated by the top of each colored bar. One-sided capped lines represent positive SD from mean.
Right: The median TTD is indicated by the horizontal bar across each colored box. The interquartile ranges are indicated by the colored boxes. The lower whiskers extend to the minimum values and the upper whiskers extend to the maximum values.
