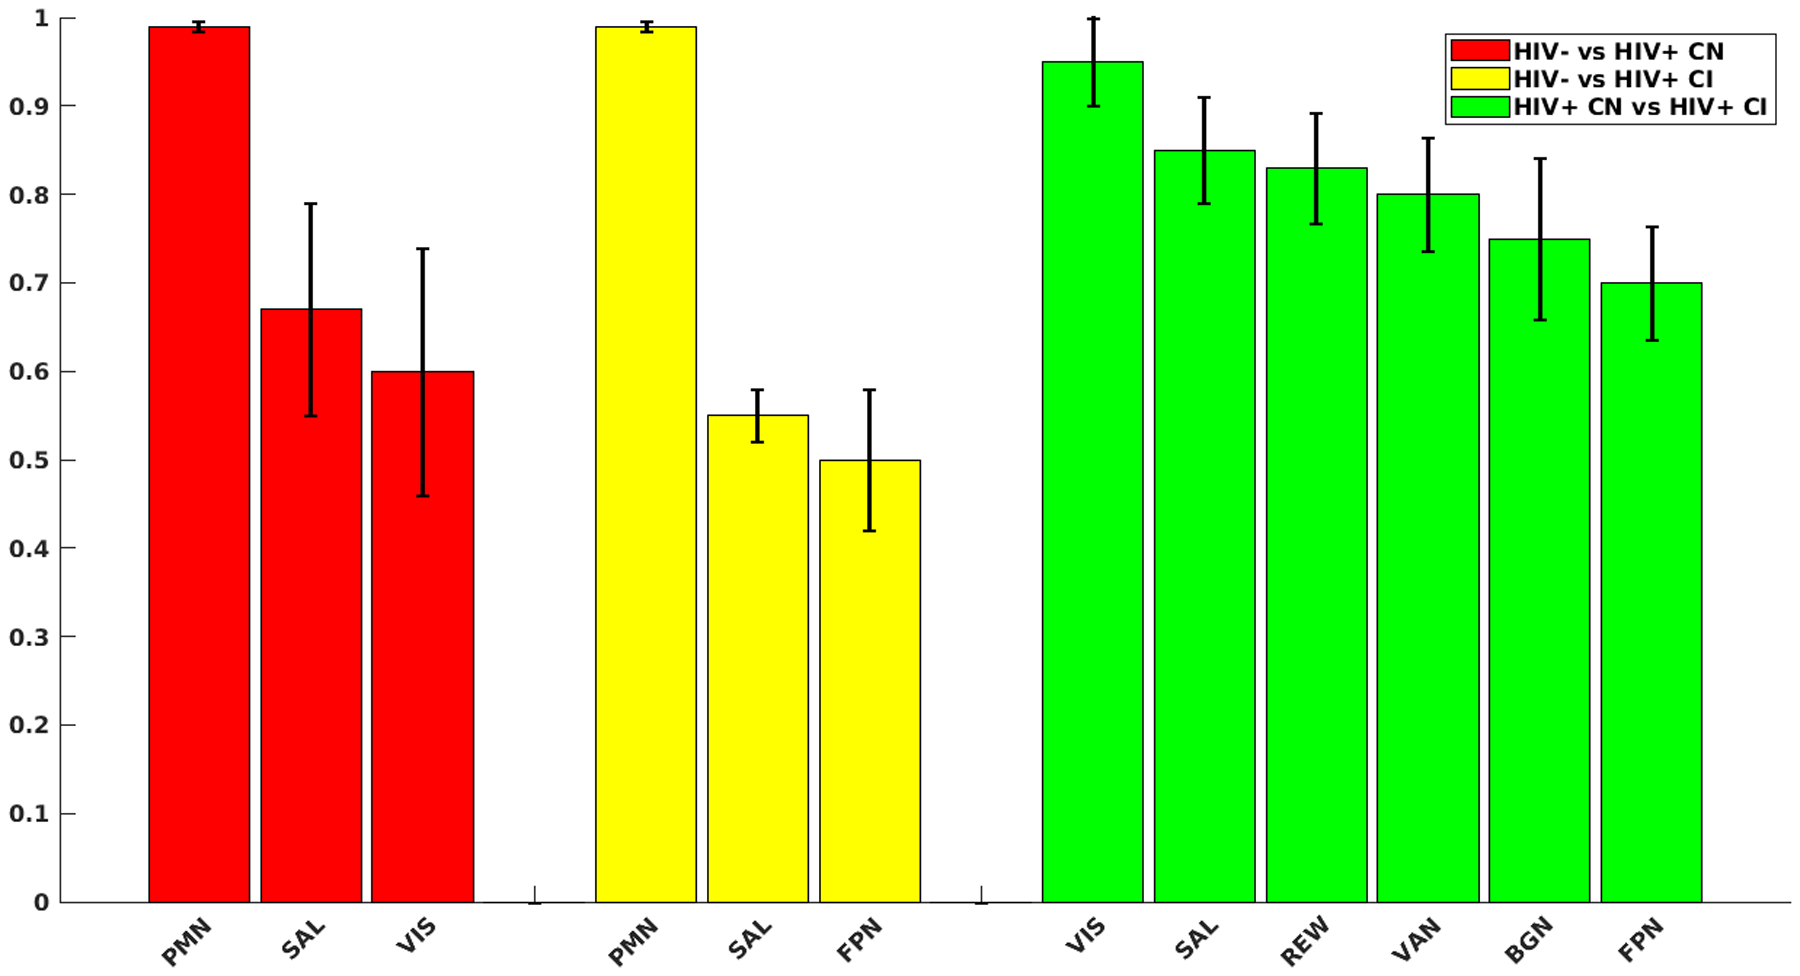
Figure 1: Strongest predictors for each group comparison.

Red bars are strongest predictors when comparing HIV status between controls and persons living with HIV (PLWH) cognitively normal. Yellow bars are strongest predictors when comparing HIV status between controls and PLWH cognitively impaired. Green bars are strongest predictors of cognitive impairment status between PLWH cognitively normal (CN) and PLWH cognitively impaired (CI). Black error bars indicate standard deviations of predictor strengths over 5 validation. Y-axis represents the predictive strength (weights) of the given networks. Weights were calculated by averaging the intra/inter network weights identified by the Relief algorithm and rescaled to a [0, 1] interval. Networks with weights close to one were the strongest predictors for a given outcome variable.
