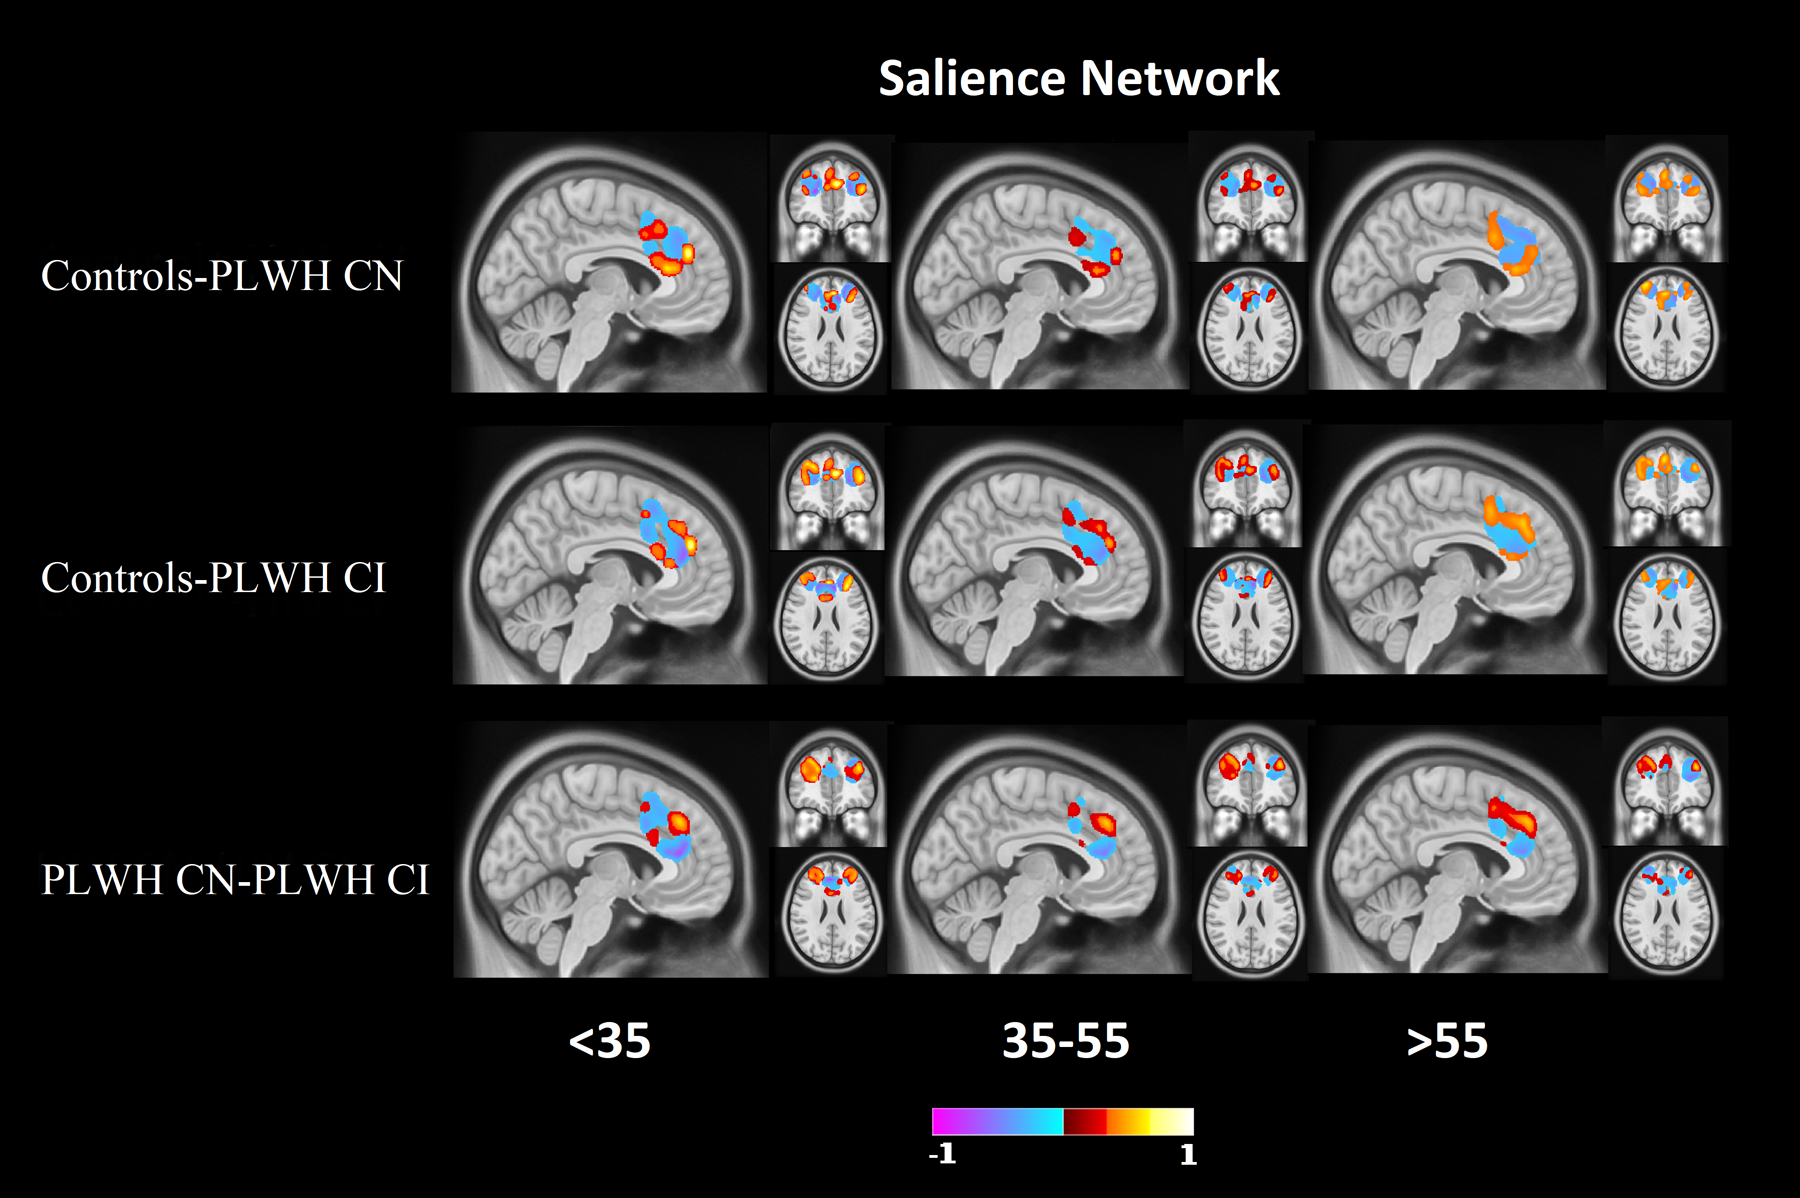
Figure 2: Difference maps for the salience (SAL) resting state network (RSN).

Difference maps for the SAL network at 0.2 minimum threshold, which was identified as a RSN with strong predictive ability to differentiate the three groups. Mixtures of higher and lower resting state functional connectivity (RS-FC) for group dependent regions were observed in the anterior cingulate cortex (ACC) and dorsolateral prefrontal cortex (DLPFC). Red indicates regions where controls have a stronger network signal compared to PLWH (top 2 rows), or PLWH CN have a higher network strength than PLWH CI (bottom row). Blue indicates regions where controls have a weaker network signal compared to PLWH (top 2 rows), or PLWH CN have a weaker network strength than PLWH CI (bottom row).
