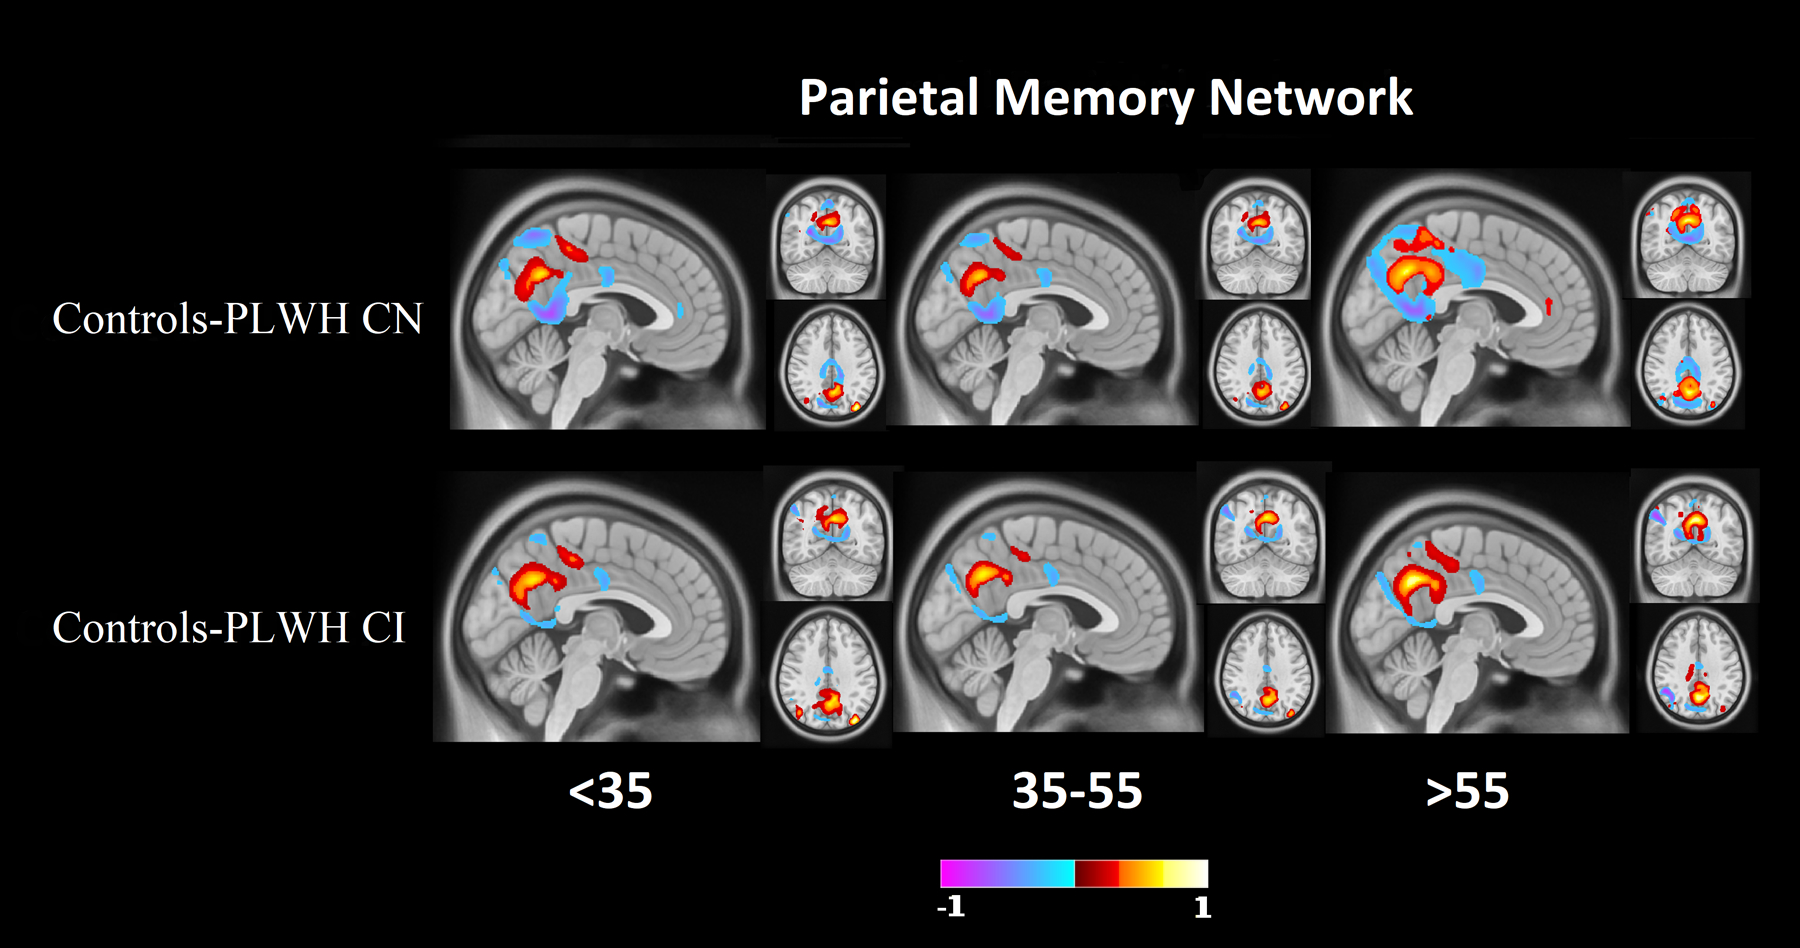
Figure 3: Difference maps for the parietal memory network (PMN).

Difference maps of PMN at 0.2 minimum threshold, identified as a strong predictor between controls and PLWH CN groups and controls and PLWH CI groups. Differences were primarily observed in parietal regions and the retrospenial cortex. Red indicates regions where controls have a stronger network signal compared to PLWH. Blue indicates regions where controls have a weaker network signal compared to PLWH.
