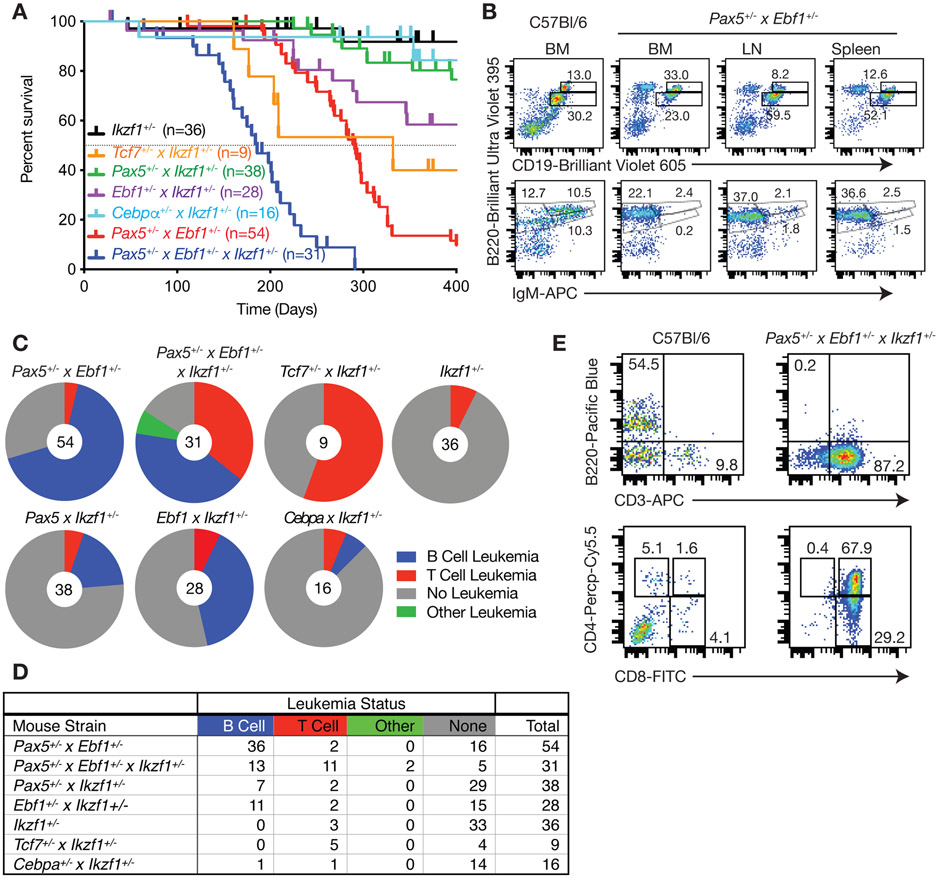
Figure 1.
Compound haploinsufficiency for transcription factor genes drives B cell or T cell leukemia. A Kaplan-Meier survival analysis of mice of the indicated genotype. Tick marks represent censored mice. B Flow cytometric analysis of control C57Bl/6 bone marrow (BM) cells or bone marrow, lymph node (LN), and spleen cells from Pax5+/−xEbf1+/− leukemic mice. Representative flow cytometric analysis of B220, CD19, and IgM expression is shown. Doublets were gated out and a lymphocyte gate was set based on side and forward scatter properties. All gates shown are based on bone marrow isolated from control C57Bl/6 mice. This mouse was 267 days old. C Pie charts showing the number of leukemias from each genotype that were either of the B cell (Blue), T cell (Red) or other (Green) phenotype; grey represents mice that failed to develop leukemia or were censored. D The table provides the numbers of mice from the pie charts included in each group and is color-coded to match the pie charts. E Flow cytometric analysis of bone marrow cells from control C57Bl/6 and Pax5+/−xEbf1+/−xIkzf1+/− leukemic mice. Representative flow cytometric analysis of B220, CD3, CD4, and CD8 expression on bone marrow cells is shown. Doublets were gated out and a lymphocyte gate was set based on side and forward scatter properties. All gates shown are based on bone marrow isolated from control C57Bl/6 mice.

