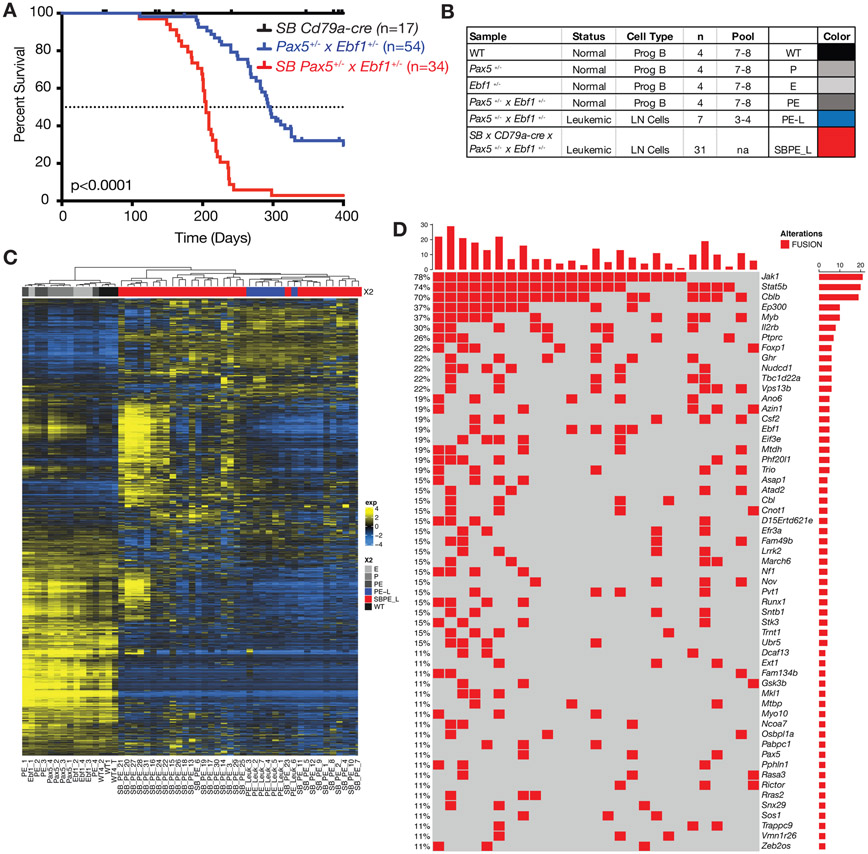
Figure 2.
Sleeping Beauty mutagenesis screen to identify genes that cooperate with Pax5 and Ebf1 heterozygosity to induce leukemia. A Kaplan-Meier survival analysis of mice comparing Pax5+/−xEbf1+/− leukemic mice (n=54) and SB Pax5+/−xEbf1+/− (n=34) leukemic mice to control mice SBxCd79a-Cre (n=17). P-value compares Pax5+/−xEbf1+/− versus SB Pax5+/−xEbf1+/− mice. B Table indicating all of the samples used in RNA-Seq analysis. The table indicates the status, type and number of samples utilized for the RNA-Seq. Control samples represent progenitor B cell pools from 7-8 C57Bl/6 (WT), Pax5+/−, Ebf1+/−, and Pax5+/−xEbf1+/− pre-leukemic mice. Three to four leukemic mouse samples were pooled using the online tool from Graphpad Quickcalcs Randomizer. Colors are added for interpretation of subsequent figures. B220+CD19+Lambda−Kappa− cells were used for all control samples. C Hierarchical clustering of all leukemic and control samples. D Fusions identified from RNA-Seq analysis of our sleeping beauty mutagenesis screen. This chart identifies recurrent insertions found in 27 of the 31 samples tested. Each column represents a different leukemic mouse and each row different targeted genes (red indicates an SB insertion was found ).

