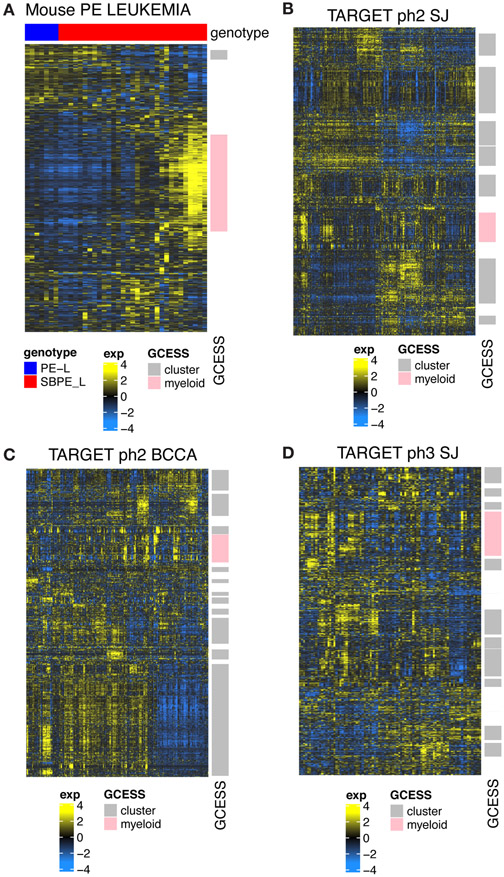
Figure 7.
Transcriptome profiles from leukemic progenitor B cells show common inter-leukemic transcriptional variation across human and mouse samples. Heatmaps showing GCESS clusters were generated to allow direct visualization of gene expression heterogeneity in RNA-SEQ from mouse leukemias (A) generated in Pax5+/−xEbf1+/− mice with and without SB accelerated tumorigenesis and (B,C,D) human ALL datasets obtained from the TARGET database. Gene transcript values derived from samples were log transformed and mean centered within each of the 4 datasets independently. Invariant (low SD) genes were removed prior to unsupervised average linkage clustering. GCESS based conservation was apparent in all human datasets despite the fact that the SJ set was summarized as gene symbols while the BCCA set was summarized to ENSEMBL ids. Transcripts with increased levels are shown in yellow, while transcripts with decreased levels are shown in blue. Gene cluster overlap analyses comparing clusters derived from human and mouse tumors show that the variation present in our mouse dataset represents one of the many GCESS clusters conserved in all of the human samples. This cluster is labeled in pink in each of the datasets in the row annotation and is labeled “myeloid”. Gene lists for the conserved pink cluster from each dataset are provided in Supplementary Table 4.

