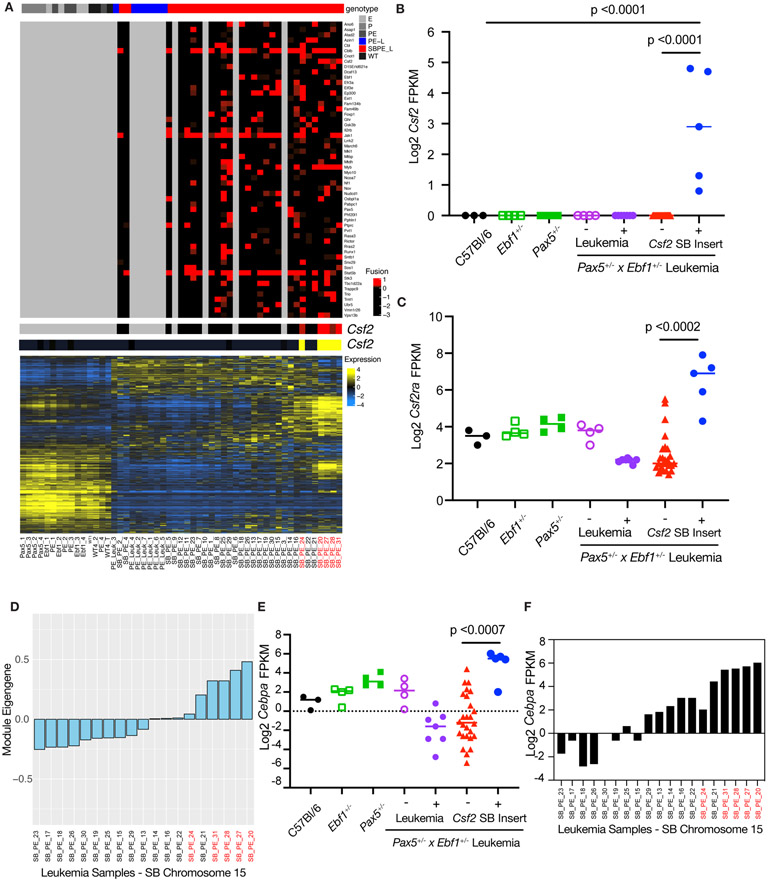
Figure 8.
Leukemias with a Myeloid Gene Signature. A The genotype of the sample is shown in the top panel with SB accelerated tumors shown in red and the PE leukemias shown in blue. The second panel shows each recurrent SB fusion based on the number of reads that support the fusion. Four SB accelerated samples did not show any recurrent fusions. The third and fourth panel highlight fusions in CSF2 (red) and the corresponding transcript level (yellow). The final panel shows the overall RNA-Seq landscape, and the samples are ordered based on hierarchical clustering of transcript profiles. Samples with the Csf2 insertion are labeled in red. B Log2 transformed fragments per kilobase of exon model per million reads mapped (FPKM) values for Csf2 from C57Bl/6 (black filled, n=3), Ebf1+/−(green open, n=4), Pax5+/−(green filled, n=4), Pax5+/−xEbf1+/− pre-leukemic (purple open, n=4), Pax5+/−xEbf1+/− leukemic (purple filled, n=7), and SB Pax5+/−xEbf1+/− leukemic samples without (red filled, n=26) or with (blue filled, n=5) a transposon insertion. Significance was tested using a Kruskal-Wallis test with Dunn’s multiple comparison test and the line represents median. C Log2 transformed fragments per kilobase of exon model per million reads mapped (FPKM) values for Csf2ra from C57Bl/6 (black filled, n=3), Ebf1+/−(green open, n=4), Pax5+/−(green filled, n=4), Pax5+/−xEbf1+/− pre-leukemic (purple open, n=4), Pax5+/−xEbf1+/− leukemic (purple filled, n=7), and SB Pax5+/− x Ebf1+/− leukemic samples without (red filled, n=26) or with (blue filled, n=5) a transposon insertion for Csf2. Significance was tested using a Kruskal-Wallis test with Dunn’s multiple comparison test and the line represents median. D Weighted Gene co-expression network analysis (WGCNA) of SB Chromosome 15 RNA-Seq samples. Module eigengene values corresponding to each SB leukemia are plotted. E Log2 transformed fragments per kilobase of exon model per million reads mapped (FPKM) values for Cebpa from C57Bl/6 (black filled, n=3), Ebf1+/−(green open, n=4), Pax5+/−(green filled, n=4), Pax5+/−xEbf1+/− pre-leukemic (purple open, n=4), Pax5+/−xEbf1+/− leukemic (purple filled, n=7), and SB Pax5+/−xEbf1+/− leukemic samples without (red filled, n=26) or with (blue filled, n=5) a Csf2 transposon insertion. Significance was tested using a Kruskal-Wallis test with Dunn’s multiple comparison test and the line represents median. Samples with the Csf2 insertion are labeled in red. F Log2 transformed fragments per kilobase of exon model per million reads mapped (FPKM) values for Cebpa from SB Leukemia Samples that were generated from Chromosome 15 transposon harboring mice. The order of samples on the x-axis is identical to that shown in panel D for comparison. Samples with the Csf2 insertion are labeled in red.

