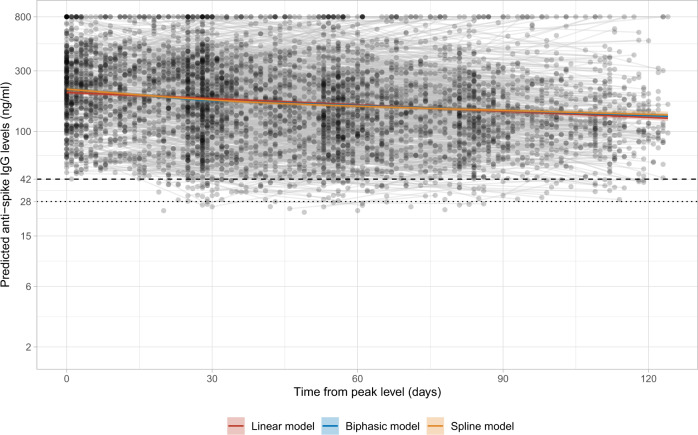
Fig. 4. Estimated mean trajectory of anti-spike IgG antibody levels and individual trajectories in 3271 participants in Class 1.
The timing of the peak level 56 days after the first positive swab is determined from the latent class mixed model. Estimated trajectories from three models are presented: the model assuming a linear decline in log2 scale (red line), the biphasic exponential model (blue line), and the model using splines (orange line). For the biphasic model, knot is placed at 28 days. For the spline model, time is fitted using natural cubic splines with internal knots at 30, 70 and boundary knots at 5, 110. The posterior mean and 95% credibility interval are shown. Black dashed line indicates the assay threshold for IgG positivity (42 ng ml−1) and the dotted line indicates level associated with 50% protection against re-infection (28 ng ml−1).

