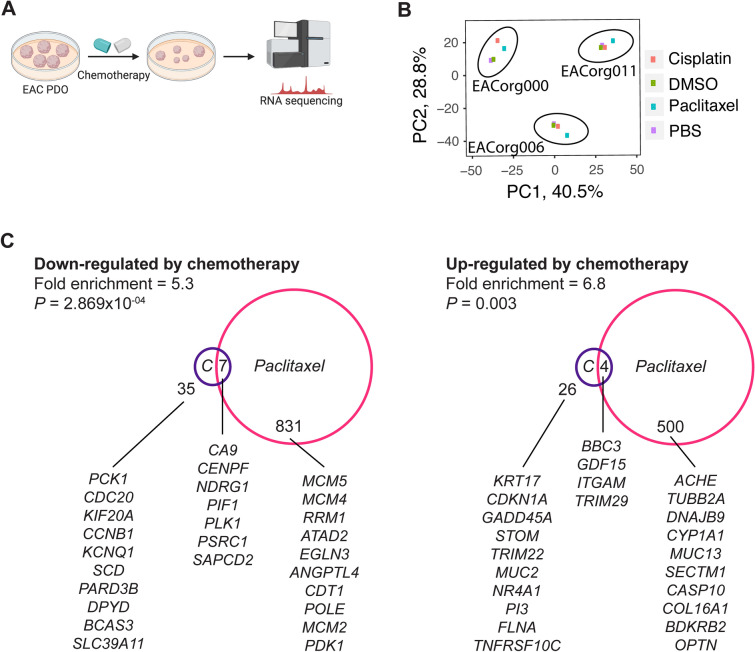
Figure 4.
EAC PDOs can be used to identify drivers of therapeutic response. (A) Schematic of the RNAseq setup. Created with BioRender.com. (B) Principle component analysis (PCA) of differentially expressed genes with P < 0.02. (C) Venn diagrams of DEGs (P < 0.02) induced by cisplatin or paclitaxel treatments, and the 10 most significantly altered genes are listed. Significance of overlap and fold enrichment as determined by hypergeometric test.

