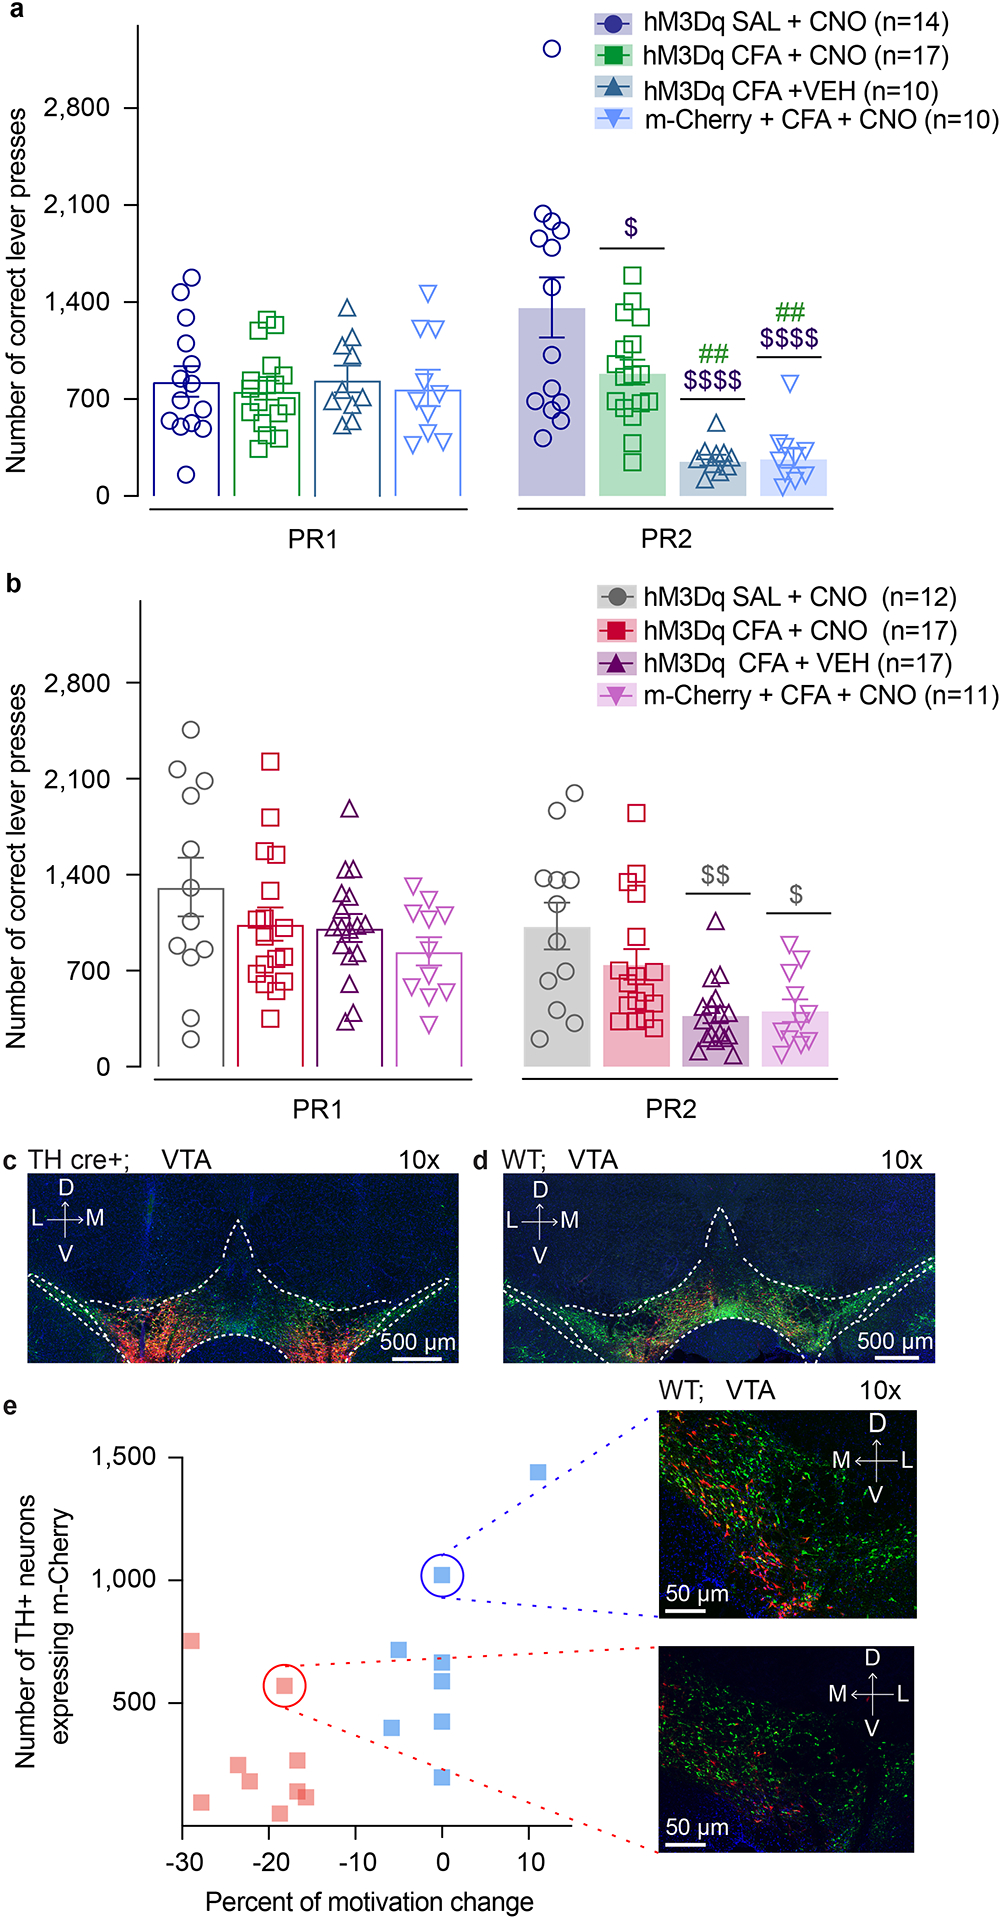
Extended Data Fig. 4. Chemogenetic activation of VTA DA neurons, or VTA-NAcSh pathway reverses CFA induced decrease in number of correct lever presses for sucrose rewards in PR task.

a. Activation of DA containing neurons in the VTA reverses CFA induced decrease in number of correct lever presses in sucrose PR. Animals injected with control virus and CNO alone showed decrease in the number of correct lever presses after the CFA injection (two-way ANOVA for repeated measures, time: F1, 47 = 3.361, p=0.0731; interaction (time × treatment): F3, 47 = 21.02, p<0.0001; Sidak’s post hoc between groups during PR2: hM3Dq + CFA + VEH (n=10) versus hM3Dq + SAL+ CNO (n=14) , $$$$ p<0.001, hM3Dq + CFA + VEH versus hM3Dq + CFA+ CNO (n=17), ## p=0.002; m-Cherry + CFA + CNO (n=10) versus hM3Dq + SAL+ CNO, $$$$ p<0.0001, m-Cherry + CFA + CNO versus hM3Dq + CFA+ CNO, ## p=0.0028), hM3Dq + CFA+ CNO versus hM3Dq + SAL+ CNO, $ p=0.0188). b. Activation of NAcSh projecting VTA neurons reverses CFA induced decrease in number of correct lever presses in sucrose PR. Control CFA animals injected with either CNO or virus alone show decrease in number of correct lever presses in sucrose PR (two-way ANOVA for repeated measures, time: F1, 53 = 87.59, p<0.0001; interaction (time × treatment): F3, 53 = 4.036, p=0.0117; Sidak’s post hoc during PR2 between the groups: hM3Dq + CFA + VEH (n=17) versus hM3Dq + SAL + CNO (n=12), $$ p=0.0021, m-Cherry + CFA + CNO (n=11) versus hM3Dq + SAL+ CNO, $ p=0.0116). The data are presented as the mean ± s.e.m. c. Representative coronal section of VTA DREADD expressing neurons. Blue – DAPI; Red – m-Cherry (Gq DREADD); Green – TH (DA neurons). Schematic representation of viral injections for Gq DREADD injected TH cre+ rats used for chemogenetic experiments in Figure 3 a–d. d. Representative coronal section of VTA Gq DREADD expressing neurons. Blue – DAPI; Red – m-Cherry (Gq DREADD); Green – TH (DA neurons). Schematic representation of viral injections for Gq DREADD injected wild type rats used in chemogenetics experiment in Figure 3 e–k. e. Representative images of low viral infection rate (red dotted line) correlated with decrease in motivation (red circle) and high viral infection rate (blue dotted line) correlated with no change in motivation (blue circle) during PR test using intersectional chemogenetics in CFA treated animals.
