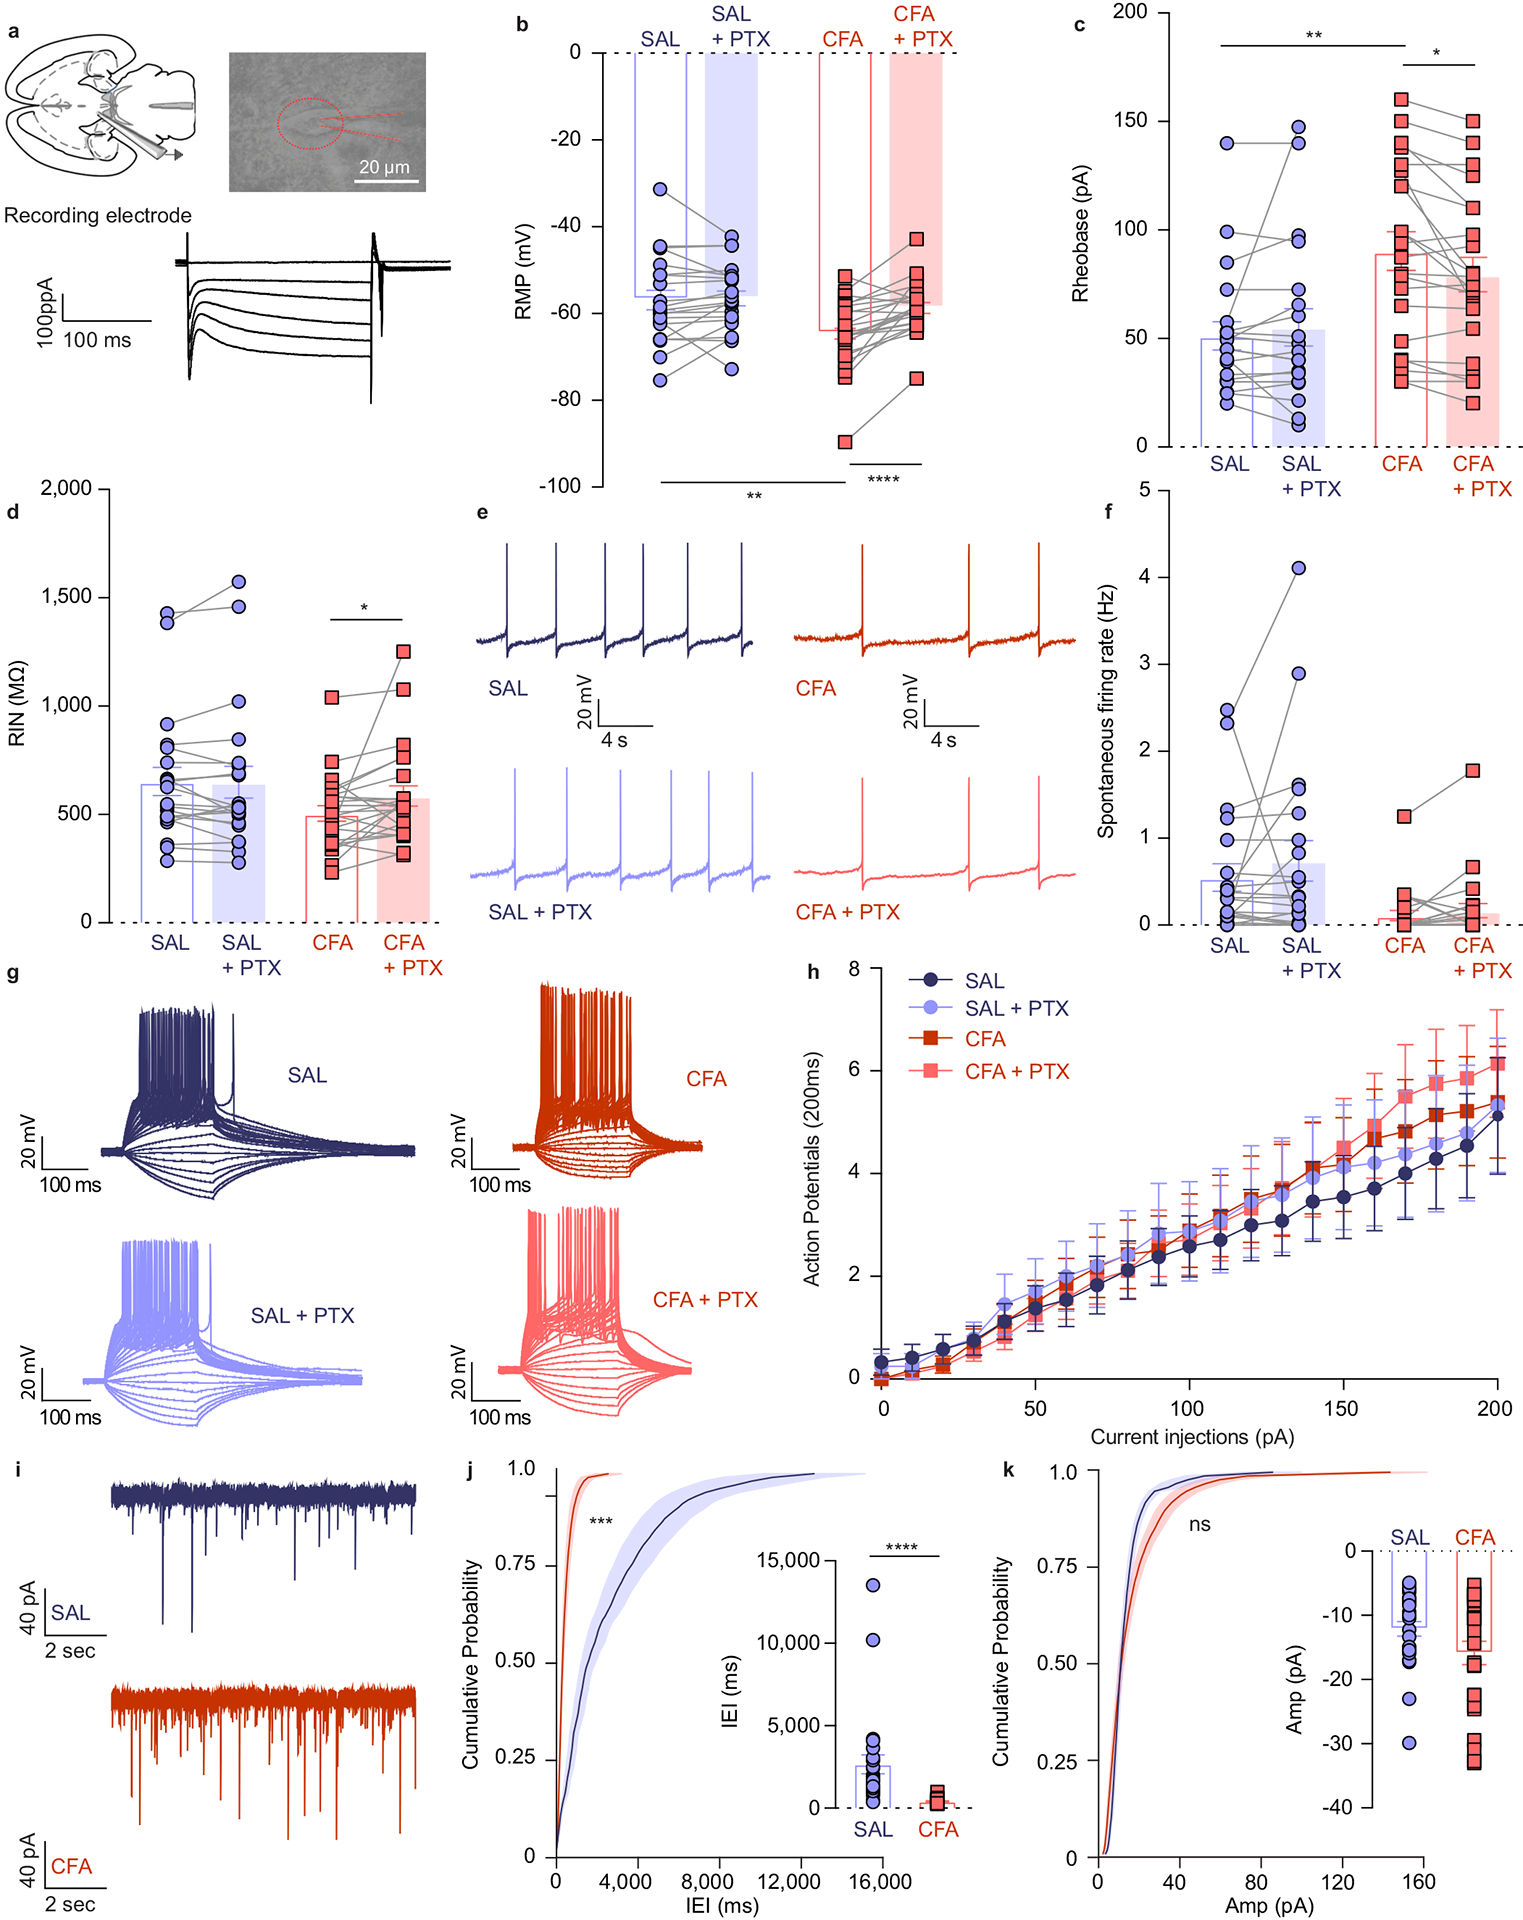
Figure 2. VTA DA cells are hyperpolarized in CFA injected animals, exhibiting decreased intrinsic excitability, and increased inhibitory drive onto them.

a. Representative picture of a patch pipette onto the soma of a VTA DA neuron. Identification of DA neurons by the presence of large hyperpolarization-activated inward current, Ih. b. Resting membrane potential (RMP) is lower in CFA group. Application of PTX restores RMP to the level of saline injected animals (two-way ANOVA for repeated measures, treatment (PTX): F1, 42 = 13.36, p=0.0007; interaction (treatment (PTX) × treatment (CFA/SAL)) : F1, 42 = 10.50, p=0.0023; Sidak’s post hoc between CFA and SAL: ** p = 0.0046 at baseline, Sidak’s post hoc between PTX and baseline: CFA,**** p < 0.0001, n (SAL) = 21 cells from 5 rats, n (CFA) = 23 cells from 4 rats). c. Amount of current necessary to evoke first action potential is higher in CFA treated rats. This effect is eliminated upon application of PTX (two-way ANOVA for repeated measures, treatment (PTX): F1, 40 = 1.327, p=0.2562; interaction (treatment (PTX) × treatment (CFA/SAL)): F1, 40 = 6.113, p=0.0178; Sidak’s post hoc between CFA and SAL: ** p = 0.0021 at baseline, Sidak’s post hoc between PTX and baseline: CFA, * p = 0.0242, n (SAL) = 20 cells from 5 rats, n (CFA) = 23 cells from 4 rats). d. CFA does not alter input resistance, while application of PTX increases input resistance in the CFA treated animals (two-way ANOVA for repeated measures, treatment (PTX): F1, 42 = 3.037, p=0.0887; interaction (treatment (PTX) × treatment (CFA/SAL)): F1, 42 = 3.520, p=0.0676; Sidak’s post hoc between PTX and baseline: CFA, * p = 0.0243, n (SAL) = 21 cells from 5 rats, n (CFA) = 23 cells from 4 rats). e. Representative traces of spontaneous activity. f. Spontaneous firing rate of VTA DA neurons is not significantly altered in pain (n (SAL) = 21 cells from 5 rats, n (CFA) = 23 cells from 4 rats). g. Representative input-output traces. h. The input-output curve of neuronal excitability is not altered by pain or PTX (n (SAL) = 12 cells from 5 rats, n (CFA) = 14 cells from 4 rats). i. Representative traces of spontaneous IPSCs. j. Frequency of sIPSCs is increased in condition of pain which as in indicative of increased inhibitory drive onto VTA DA neurons (distribution of cumulative probability for IEI represented as mean ± s.e.m.: Kolmorogov-Smirnov test = 4.925, *** p=0.001; mean IEI: **** p < 0.0001, two-tailed Mann Whitney test, n (SAL) = 27 from 5 rats, n (CFA) = 25 from 5 rats). k. Mean amplitude of sIPSCs is not altered by pain (distribution of cumulative probability for Amp represented as mean ± s.e.m.: Kolmorogov-Smirnov test = 1.196, p = 0.114 – not significant; mean Amp: p = 0.159 – not significant, two-tailed Mann Whitney test, (n (SAL) = 27 from 5 rats, n (CFA) = 25 from 5 rats). The data are presented as the mean ± s.e.m.
