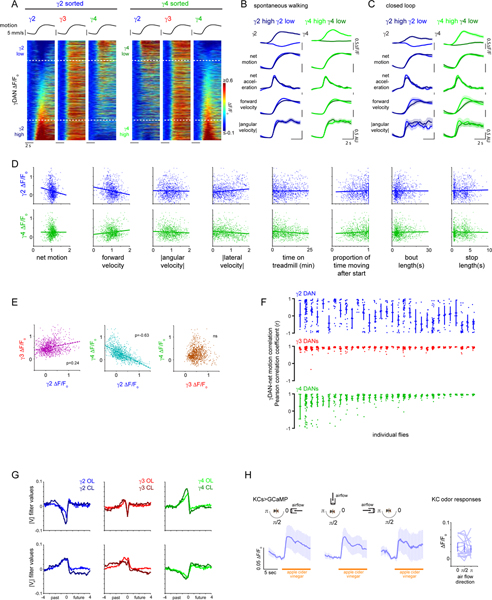
Extended Data Fig. 3. Variability of DAN - behavior correlations.
(A) Top: average motion (black) ± 95% confidence interval (CI, obscured by average line) as animals initiate locomotion. Bottom: heat map of ΔF/Fo in γ DANs aligned to movement initiation. Rows (bouts) ordered by average γ2 (left) or γ4 (right) ΔF/Fo. Dashed lines indicate 20% of trials with highest or lowest average ΔF/Fo. N=53 animals, 1060 starts. (B) DAN activity and parameters of locomotion during spontaneous movement initiation in which γ2 and γ4 were most differentially active). Left: average γ2 ΔF/Fo (top), motion (2nd row), acceleration (3rd), forward velocity (4th), and |angular velocity| (bottom) ± 95% CI as animals initiated locomotion. 20% of bouts of movement initiation with highest (dark) and lowest (lighter) average γ2 ΔF/Fo as indicated by lines in (A). Right: as left but for with highest (ligher) and lowest (dark) average γ4 ΔF/Fo. N=212 bouts. (C) As in (B) but for flies walking in non-odorized air in closed-loop. N=91 bouts. (D) γ2 (top) and γ4 (bottom) DAN activity vs different behavioral variables. N=1060 bouts. All Pearson correlation coefficients are either weak (|r|<0.18) or not significant (no Bonferroni correction). (E) Comparisons of average DAN ΔF/Fo during the onset of locomotion. Pearson correlation coefficient (r) indicated where relationship is statistically significant (p<0.00001, Bonferroni correction, see Supplementary Table 2). N=1060 starts. (F) Pearson correlation coefficient between change in DAN activity and net motion during bouts of movement initiation for flies walking in clean air in closed-loop. Columns (flies) ordered by average γ4-motion correlation. N=32 animals, 452 starts. (G) Filters predicting DAN activity from forward velocity (top) or |angular velocity| (bottom) in open loop (OL, as in Figure 1F, light lines) or closed-loop (CL) in clean air. ± 95% CI. OL: N=66 animals, 119 5-minute trials. CL: N=20 animals, 32 5-minute trials. (H) Comparison of γ Kenyon Cells activity during presentation of apple cider vinegar from indicated angles. Average ΔF/Fo (dark line) ± 95% CI aligned to odor onset. Right: average ΔF/Fo during odor presentation from indicated angles. N=16 animals, 3 odor presentations per orientation (total 144 odor presentations). One-way ANOVA followed by Tukey’s multiple comparison test; no statistical significance observed.

