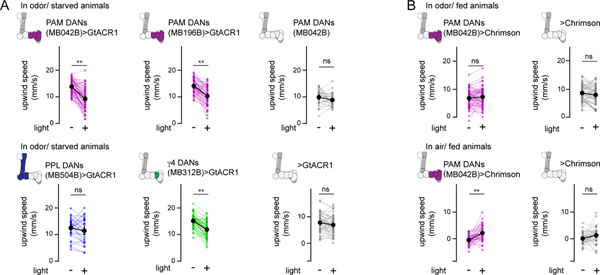
Extended Data Fig. 10. Optogenetic inhibition or excitation of PAM DANs bidirectionally influences upwind tracking behavior.
(A) Average upwind velocity during odor presentations preceding optogenetic inhibition (−) and during odor presentations paired with optogenetic inhibition (+) for the indicated genotypes in starved animals. PAM DANs (MB042B driver)>GtACR1 (N=63, top left), PAM DANs (MB196B driver)>GtACR1 (N=49, top middle), PAM DANs MB042B-Gal4 parental controls (N=33, top right), PPL DANs (MB504B driver)>GtACR1 (N=30, bottom left), γ4 DANs (MB312B driver)>GtACR1 (N=54, bottom middle), UAS-GtACR1 parental controls (N=48, bottom right). Paired two-sided t-test with Bonferroni correction, p<10–5 (**), see Supplementary Table 2. (B) Top: average upwind speed in odor presentations preceding optogenetic activation (−) and in odor predsentations paired with optogenetic activation (+) in fed PAM DANs (MB042B driver)>CsChrimson flies (left) and UAS-CsChrimson parental controls (right). N=60 paired cohorts of PAM>CsChrimson and parental control animals assayed together during a single experiment. Bottom: average upwind speed of fed animals in clean air preceding optogenetic activation (−) and with optogenetic activation (+) for fed PAM DANs (MB042B driver)>CsChrimson flies (left) and UAS-Chrimson parental controls (right). N=44 paired cohorts of PAM>CsChrimson and parental control animals assayed together during a single experiment. Paired two-sided t-test with Bonferroni correction, p<10–5 (**), see Supplementary Table 2.

