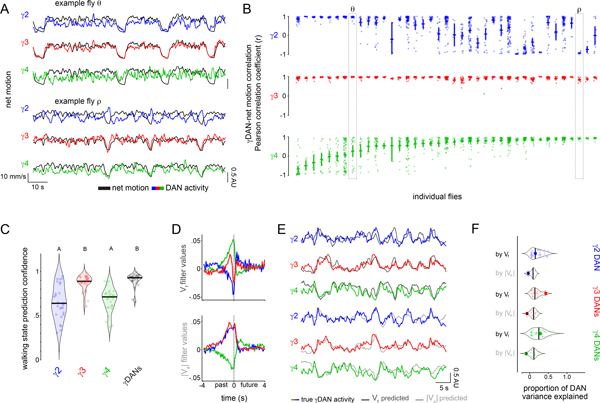
Figure 2. Differential encoding of behavior by mushroom body DANs.
(A) Representative experiments showing the variable relationship between the net motion (black) of a fly and DAN activity (colored) during bouts of spontaneous locomotion. Traces from flies θ and ρ are denoted in (B). (B) Pearson correlation coefficient between change in DAN activity and net motion at the onset of sustained locomotion (≥3 sec) following a pause (≥2 sec). Each column depicts all the bouts of movement initiation from an individual fly. Flies are ordered by the average correlation coefficient for γ4 DAN activity-net motion. N=39 animals, 1043 movement initiations. (C) Probability that a logistic regression model generated from DAN activity can accurately predict the locomotor state of an animal. N=27 animals. One-way ANOVA followed by Tukey’s multiple comparison test. Data labeled with different letters are significantly different from each other (p < 0.0001). (D) Linear filters predicting DAN activity during bouts of continuous movement using forward velocity (Vf, top) or |angular velocity| (|Va|), bottom) centered on an 8 second window. Plots include a 95% confidence interval that is obscured by the thickness of the average line. N=66 animals, recorded for 119 five-minute trials. (E) Overlay of true DAN activity (colored) and predicted DAN activity (gray) generated from linear filters in (D). (F) Proportion of variance (R2adjusted) of γ DAN activity explained by forward velocity and |angular velocity|. Example traces in (E) denoted by opaque point. N=66 animals, 119 five-minute trials.

