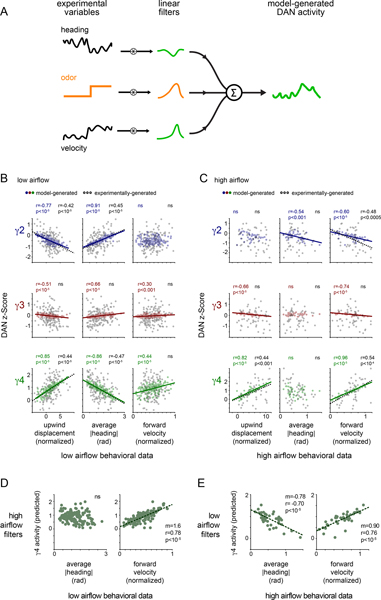
Figure 5. Analysis of dynamic DAN-motor correlations during odor pursuit.
(A) Schematic of analysis in which linear filters are applied to the experimental forward velocity or |heading| data to predict DAN activity over an odor trial (see methods for details). (B) Average predicted DAN activity plotted as a function of upwind displacement (left), |heading| (middle), and forward velocity (right) for each odor trial under low airflow conditions. Best fit line and Pearson correlation coefficient (r) indicated where relationship is statistically significant (p<.01 with Bonferroni correction, see Supplementary Table 2). N=26 flies, 143 odor presentations. (C) Average predicted DAN activity plotted as a function of experimentally determined upwind displacement (left), average |heading| (middle), and average forward velocity (right) for each odor trial under high airflow conditions. Best fit line and Pearson correlation coefficient (r) indicated where relationship is statistically significant (p<.05 with Bonferroni correction, see Supplementary Table 2). N=22 flies, 52 odor presentations. (D) γ4 DAN activity predicted by applying the high airflow filters to low airflow behavioral data, plotted as a function of experimentally-determined average |heading| (left) and average forward velocity (right) for each odor trial under low airflow conditions. Best fit line and Pearson correlation coefficient (r) indicated where relationship is statistically significant (p<.01 with Bonferroni correction, see Supplementary Table 2). N=26 flies, 143 odor presentations. (E) γ4 DAN activity predicted by applying the low airflow filters to high airflow behavioral data, plotted as a function of the experimentally-determined average |heading| (left) and average forward velocity (right) for each odor trial under high airflow conditions. Best fit line and Pearson correlation coefficient (r) indicated where relationship is statistically significant (p<.01 with Bonferroni correction, see Supplementary Table 2). N=22 flies, 52 odor presentations.

