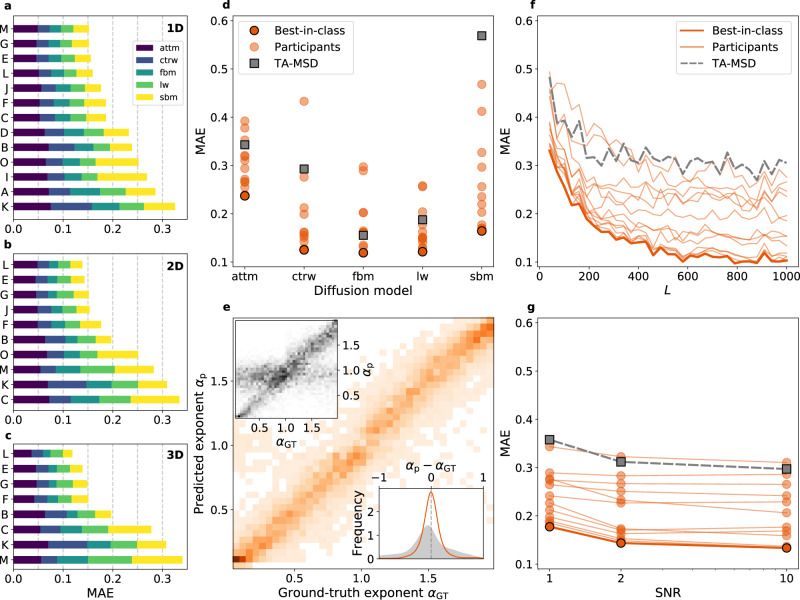
Fig. 2. Challenge results for Task 1: inference of α.
a–c Final leaderboards according to the MAE obtained by participants for 1D (a), 2D (b), and 3D (c). The colors represent the relative contributions to the overall mean absolute error (MAE) calculated for each underlying diffusion model and normalized such that the sum of all contributions gives the value of the same metric calculated over the whole dataset. d MAE obtained by participating teams as a function of the diffusion model for 1D trajectories. e Probability distribution of the predicted vs ground-truth anomalous diffusion exponent for the best-in-class team in 1D (team M). Insets: (top left) Probability distribution of the predicted vs. ground-truth anomalous diffusion exponent for the baseline method (TA - MSD). (bottom right) Frequency of the bias between predicted and ground-truth anomalous diffusion exponent for the best-in-class team (team M, orange line) and the baseline method (TA - MSD, gray area) in 1D. f MAE obtained by participating teams as a function of the trajectory length in 1D. g MAE obtained by participating teams as a function of the SNR in 1D. All results for T1 in 1D, 2D, and 3D are provided in Supplementary Figs. 3, 6-9, 14-16.

