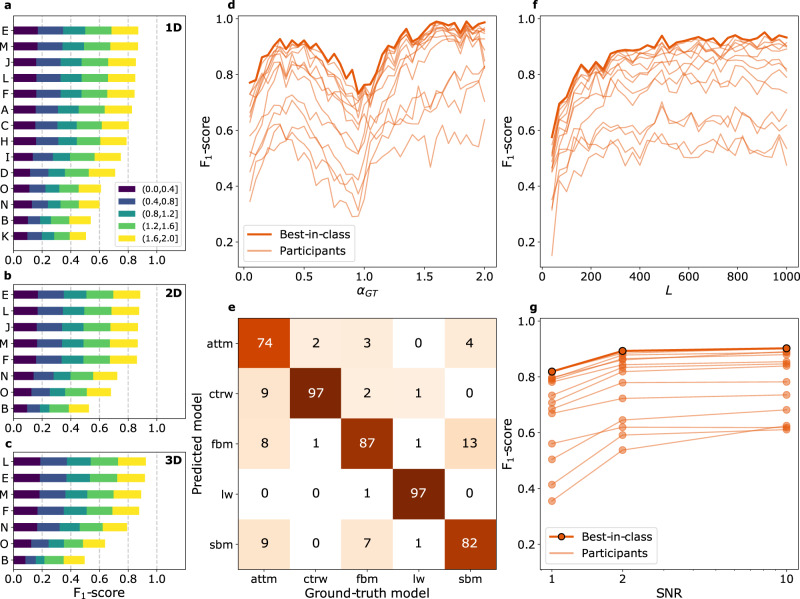
Fig. 3. Challenge results for Task 2: diffusion model classification.
a–c, Final leaderboards according to the F1-score obtained by participants for 1D (a), 2D (b), and 3D (c). The colors represent the relative contributions to the overall F1-score calculated for different ranges of anomalous diffusion exponents and normalized such that the sum of all contributions gives the value of the same metric calculated over the whole dataset. d F1-score obtained by participating teams as a function of the anomalous diffusion exponent for 1D trajectories. e Confusion matrix for the predictions of the best-in-class team in 1D (team E). Numbers in matrix cells represent the number of correctly and incorrectly classified trajectories for each ground-truth model as percentages of the number of trajectories of the corresponding ground-truth model (column-based normalization, so that their sum along the columns should add up to 100, with minor deviation due to rounding). Thus, the percentages of correctly classified observations can be thought of as class-wise recalls. f F1-score obtained by participating teams as a function of the trajectory length in 1D. g F1-score obtained by participating teams as a function of the SNR in 1D. All results for T2 in 1D, 2D, and 3D are provided in Supplementary Figs. 4, 10-13, 17-20.

