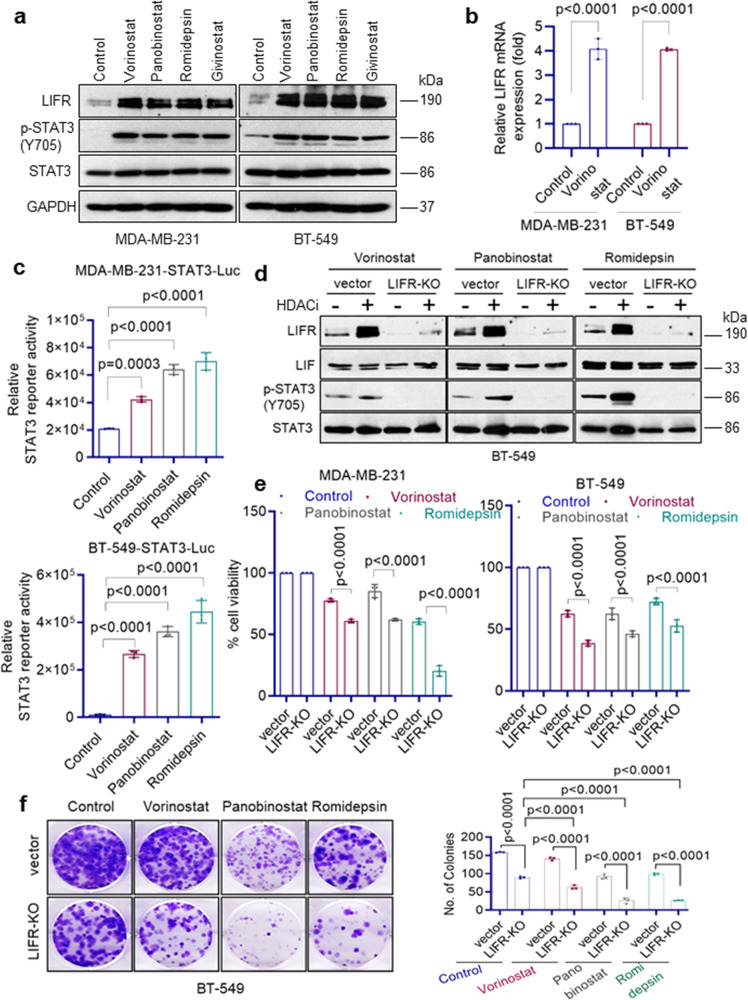
Fig. 1. HDACi treatment-induced STAT3 activation via LIFR expression.
a TNBC model cells (MDA-MB-231 and BT-549) were treated with indicated HDACi (vorinostat: 10 µM; panobinostat: 1 µM; romidepsin: 1 µM; givinostat: 1 µM) for 24 h and expression of LIFR, p-STAT3(Y705), and STAT3 were determined using Western blotting. b MDA-MB-231 and BT-549 cells were treated with vorinostat (10 µM) for 10 h and levels of LIFR were measured by RT-qPCR. RT-qPCR data were normalized to GAPDH and data are representative of three independent experiments (n = 3). c MDA-MB-231 and BT-549 cells stably expressing STAT3-luc reporter were treated with indicated HDACi and reporter activity was measured after 24 h. Data are representative of three independent experiments (n = 3). d BT-549 vec or BT-549 LIFR-KO cells were treated with indicated HDACi (vorinostat: 10 µM; panobinostat: 1 µM, romidepsin: 1 µM) for 10 h and induction of LIFR, LIF, and p-STAT3(Y705) was measured by Western blotting. The effect of LIFR-KO on the activity of HDACi was determined using MTT cell viability assay (e) and clonogenic survival assay (f). e, f Data are representative of three independent experiments (n = 3). Error bars represent SD. In b, e, and f, p-values were calculated using two-way ANOVA. In c, p-values were calculated using one-way ANOVA.

