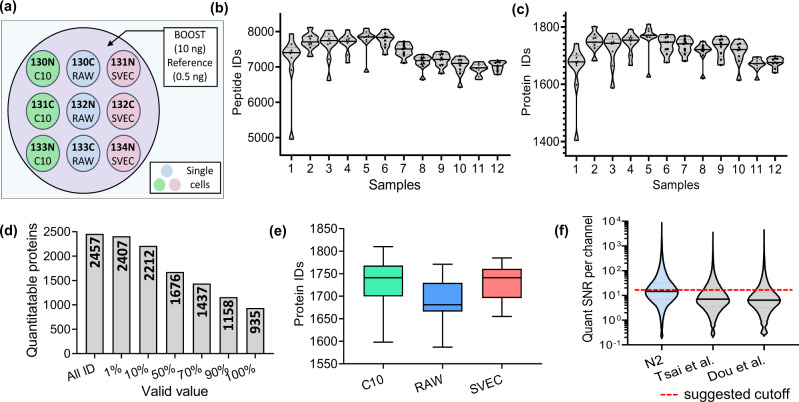
Fig. 3. Single-cell proteomics with N2 chip.
a Experiment design showing single-cell isolation and TMT labeling on the N2 chip. b, c The numbers of identified peptides and proteins in 12 TMT sets. At least one valid value in the nine single-cell channels is required to count as an identification. Centerlines show the medians; top and bottom horizontal lines indicate the 25th and 75th percentiles, respectively. The data point (n) to generate the violin plots is 9. d The numbers of quantifiable proteins based on different percentages of required valid values. e Box plot showing the distributions of protein identification numbers (n = 36 single cells for each cell type). Centerlines show the medians; box limits indicate the 25th and 75th percentiles; whiskers extend 1.5 times the interquartile range from the 25th and 75th percentiles. f Violin plot showing the distributions of signal to noise ratio (SNR) per channel for raw single-cell signals calculated by SCPCompanion17. Two published TMT scProteomics datasets from our group using nanowell chip15,16 were used to benchmark the data generated in this study. Centerlines show the medians; top and bottom horizontal lines indicate the 25th and 75th percentiles, respectively. The numbers (n) of SNR datapoints are 284,193 in N2 datasets, 282,190 in Tsai et al. datasets, and 260,039 in Dou et al. datasets. Source data are provided.

