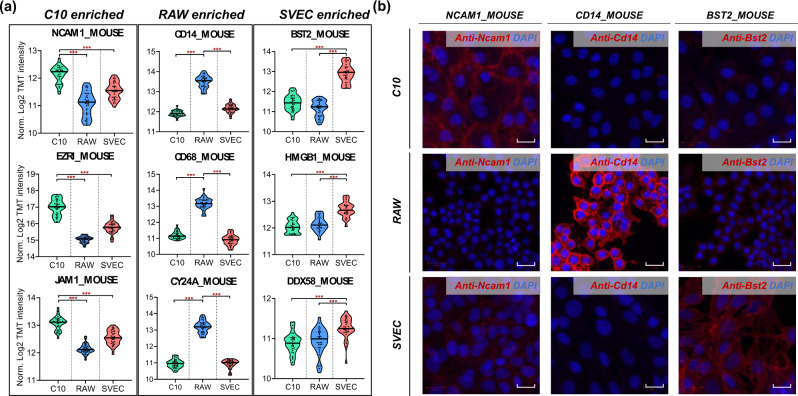
Fig. 5. Prediction of cell-type-specific surface proteins with single-cell proteomics.
a Violin plots showing nine putative plasma membrane proteins enriched in three cell types. Proteins in each column are statistically significant (Two-sided t-test, ***p-value ***<0.001) expressed in the specific cell type. Centerlines show the medians; top and bottom horizontal lines indicate the 25th and 75th percentiles, respectively. For C10, n = 34 single cells; For RAW, n = 35 single cells; For SVEC, n = 35 SVEC single cells. b Immunofluorescence images showing the expression of NCAM1_MOUSE, CD14_MOUSE, and BST2_MOUSE in three cell populations. The protein abundance is visualized with red fluorescence, and DNA is visualized by DAPI staining (blue). The length of scale bar is 20 µm. Source data are provided.

