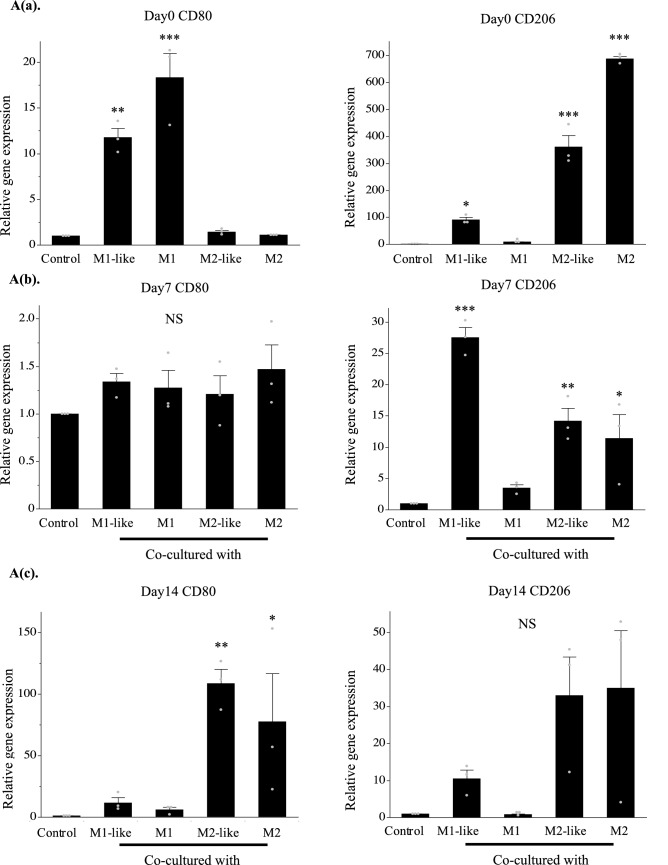
Figure 3.
Changes in polarity of macrophages over time in co-culture. (A(a)) Gene expression in macrophages after induction of differentiation (day 0). (A(b)) Gene expression in co-culture of macrophages and cartilage pellets on day 7. (A(c)) Gene expression in co-culture of macrophages and cartilage pellets on day 14. *P < 0.05, **P < 0.01, ***P < 0.0001. NS: Not significant. The data are shown as mean ± SEM (n = 3). Left: CD80, Right: CD206. (B(a)) Double immunofluorescence analysis results for the cartilage pellets on day 7 of co-culture. (B(b)) Double immunofluorescence analysis results for the cartilage pellets on day 14 of co-culture. Double immunofluorescence staining performed for CD80 (Red: Alexa fluor 647), CD206 (Green: Alexa Fluor 488), and nuclei (blue: DAPI). Magnification: 400 × , Scale bars: 100 μm. (C(a)) Quantitative evaluation based on the CD80+, CD206+, and CD80+CD206+ cell count in double immunofluorescence staining (on day 7 of co-culture). Left: CD80+cells, Middle: CD206+cells, Right: CD80+CD206+cells. *P < 0.05, **P < 0.01. NS: Not significant. The data are presented as the mean ± SEM (n = 3). (C(b)) Quantitative evaluation based on the CD80+, CD206+, and CD80+CD206+cell count in double immunofluorescence staining (on day 14 of co-culture). Left: CD80+cells, Middle: CD206+cells, Right: CD80+CD206+cells. **P < 0.01. NS: Not significant. The data are presented as the mean ± SEM (n = 3).


