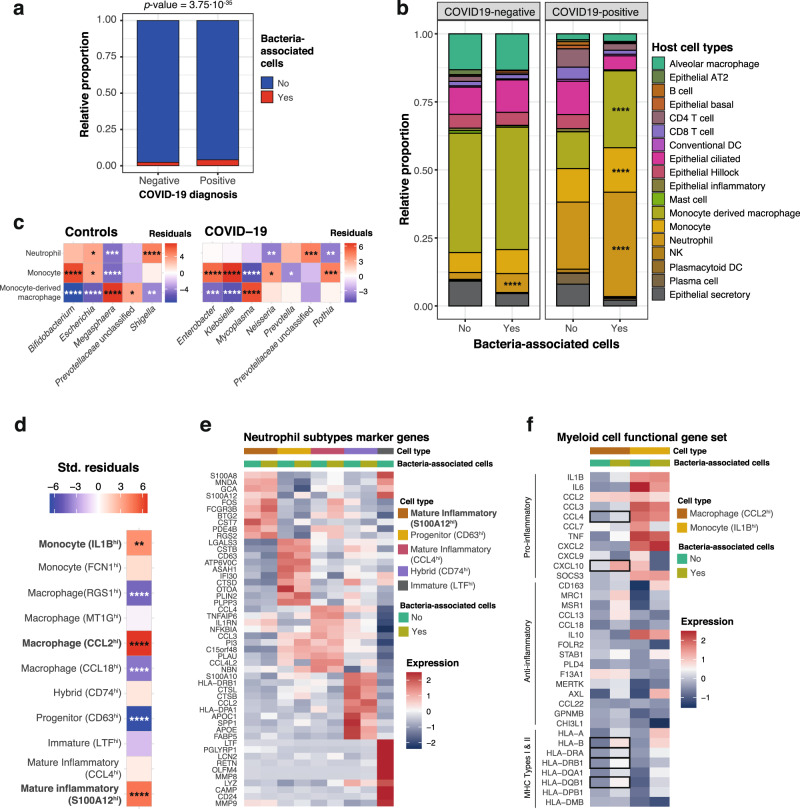
Fig. 3. Host single cells associated to the lower respiratory tract microbiota.
a relative proportion of cells from negative (n = 31,923 cells) and positive (n = 33,243 cells) COVID-19 patients with (red) and without (blue) associated bacteria. The p value of a two-tailed Chi-squared test using the count data is shown on top. b Cell types enriched in bacteria-associated cells. Barplots represent the proportion of cell types without (“No”; n = 63,463 cells) and with (“Yes”; n = 1,703 cells with 2108 bacteria detected) bacteria in COVID-19 positive and negative patients. For each patient class, we tested for enrichment of bacteria-associated cells (“Yes”) across the different cell types, using the proportions of non-bacteria associated cells (“No”) as background (Chi-squared tests, two-tailed). c Bacterial genera preferentially associating to specific cell types. The heatmaps show the standardized residuals of a two-tailed Chi-squared test including all bacterial genera and the three host cell types enriched in bacteria, for controls (left) and COVID-19 positive patients (right). Taxa with no significant associations with any of the cell types are not shown. Enrichments are shown in red; depletions are depicted in blue. d Host cell subtypes associated with bacteria. The heatmap shows the standardized residuals of a two-tailed Chi-squared test, including the subtypes of neutrophils, monocytes and monocyte-derived macrophages with associated bacteria, considering cells without bacteria as background. Enrichments are shown in red; depletions are depicted in blue. e Marker genes detected for the 5 different subtypes of neutrophils, showing within-group differences between bacteria-associated and bacteria-non-associated cells. f Myeloid cell functional gene set showing the expression of canonical proinflammatory, anti-inflammatory and MHC-encoded genes for the two subtypes of myeloid cells significantly associated with bacteria (CCL2hi-macrophages and IL1Bhi-monocytes). The heatmap also shows within group differences between bacteria-associated and non-associated cells. Statistically significant differences (two-sided Wilcoxon rank-sum test, Bonferroni-adjusted p value < 0.05) are marked with squares. For (b–d) asterisks denote significance after BH multiple testing correction as follows: *p value ≤ 0.05; **p value ≤ 0.01; ***p value ≤ 0.001; ****p value ≤ 0.0001; exact p values are provided in Supplementary Data 3. Source data are provided as a Source Data file.

