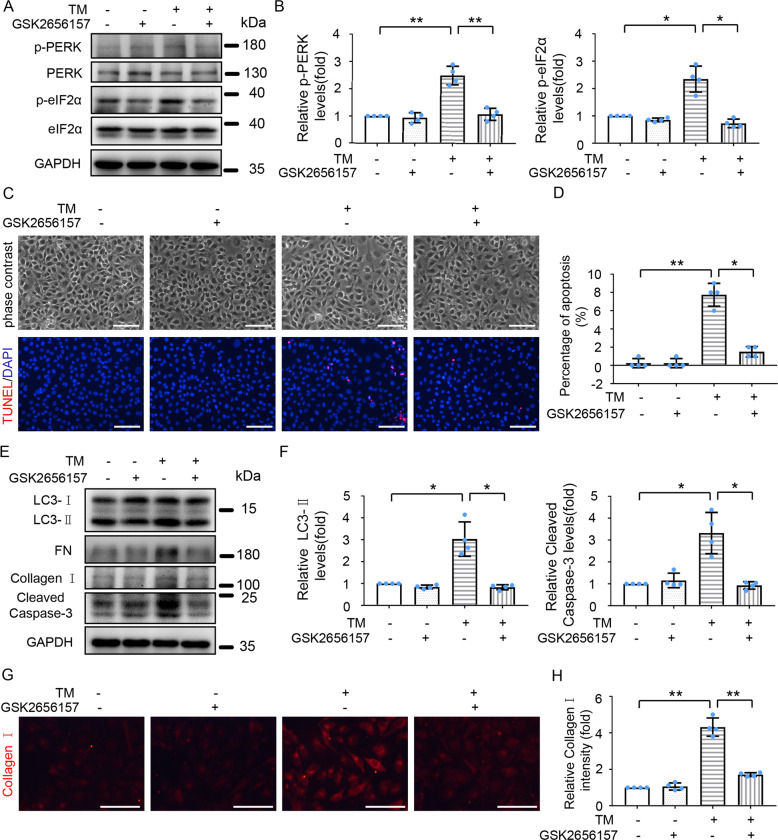
Fig. 4. Inhibition of PERK mitigates autophagy, fibrosis, and apoptosis during TM treatment of HK-2 cells.
HK-2 cells were treated with or without TM (100 nM) in the absence or presence of 1 μM GSK2656157 for 24 h. A Cell lysates were analyzed for p-PERK, PERK, p-eIF2α, eIF2α, and GAPDH by Immunoblot analysis; B Densitometric analysis of p-PERK and p-eIF2α band signals. C Representative phase-contrast and TUNEL staining images of HK-2 cells. Scale bar = 100 μm. D Counting of TUNEL staining positive cells. E Cell lysates were analyzed for LC3-II, FN, Collagen I, cleaved Caspase-3, and GAPDH by Immunoblot. F Densitometric analysis of LC3-II and cleaved Caspase-3 intensity. G Representative images of Collagen I immunofluorescence. Scale Bar = 100 μm. H Quantitative analysis of Collagen I immunofluorescence. Data are expressed as mean ± SD. n = 4. *p < 0.05, **p < 0.01.

