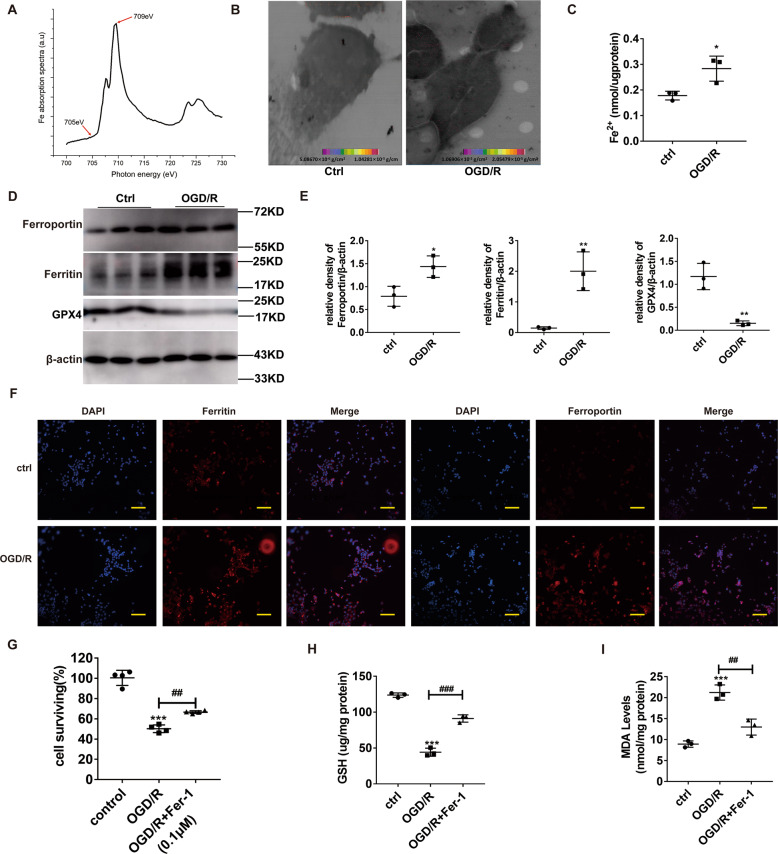
Fig. 3. OGD/R accelerates ferroptosis within pulmonary epithelial cells and enhances Nrf2, TERT, and SLC7A11 levels during ferroptosis.
A Fe L3-edge NEXAFS (near edge X-ray absorption fine structure) spectrum was acquired from two absorption cellular images scanned at two energies, E1 (709 eV) and E2 (705 eV) above and below the absorption edge of Fe, respectively. B Evaluation of Fe distribution and content using scanning transmission X-ray microscopy. C Endogenous Fe levels within the pulmonary epithelial cells of the OGD/R model, as detected by Fe assay. D Evaluation of the levels of ferroptosis-related proteins under different conditions. E Quantification of the examined proteins. F Evaluation of ferritin and ferroportin levels (red) in lung tissues, using immunohistochemistry. Nuclear staining done with DAPI (blue) after OGD/R. Scale bar: 100 μm. G Cell survival after OGD/R induction and the opposite effect with Fer-1 (0.1 μM). H GSH levels under different conditions. I MDA levels under different conditions. Error bars denote standard error from three individual experiments. Data are expressed as mean ± SEM. *P < 0.05; **P < 0.01; ***P < 0.001; *relative to control; #relative to OGD/R.

