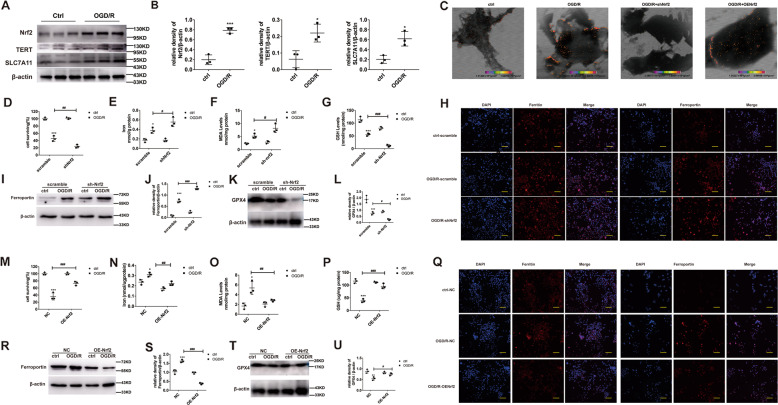
Fig. 4. Nrf2 stimulation prevents ferroptosis and the absence of Nrf2 produces more serious ferroptosis phenotype in OGD/R.
A Evaluation of Nrf2 and its potential downstream proteins via western blotting, under different conditions. B Quantification of the examined proteins. C Fe distribution and content detected via scanning transmission X-ray microscopy. D, M Evaluation of cell viability after OGD/R induction, as evidenced by CCK8 assay. Cells were assigned to three categories: (1) control, (2) OGD/R, and (3) OGD/R + Fer-1 (0.1 μM). E, N Endogenous Fe levels within pulmonary epithelial cells in the OGD/R model, as detected by Fe assay. F, O MDA levels after OGD/R induction, as assessed by MDA assay. G, P GSH levels after OGD/R induction, as assessed by GSH assay. H, Q Evaluation of ferritin and ferroportin (red), using immunohistochemistry. Nuclear staining done with DAPI (blue) after OGD/R induction. Scale bar: 100 μm. I–L, R–U Evaluation and quantification of ferroportin and GPX4 protein levels. Error bars denote standard error from three individual experiments. Data are expressed as mean ± SEM. *P < 0.05, **P < 0.01, ***P < 0.001 represent intergroup significant differences. *Relative to the sham control mice. #Relative to the OGD/R control.

