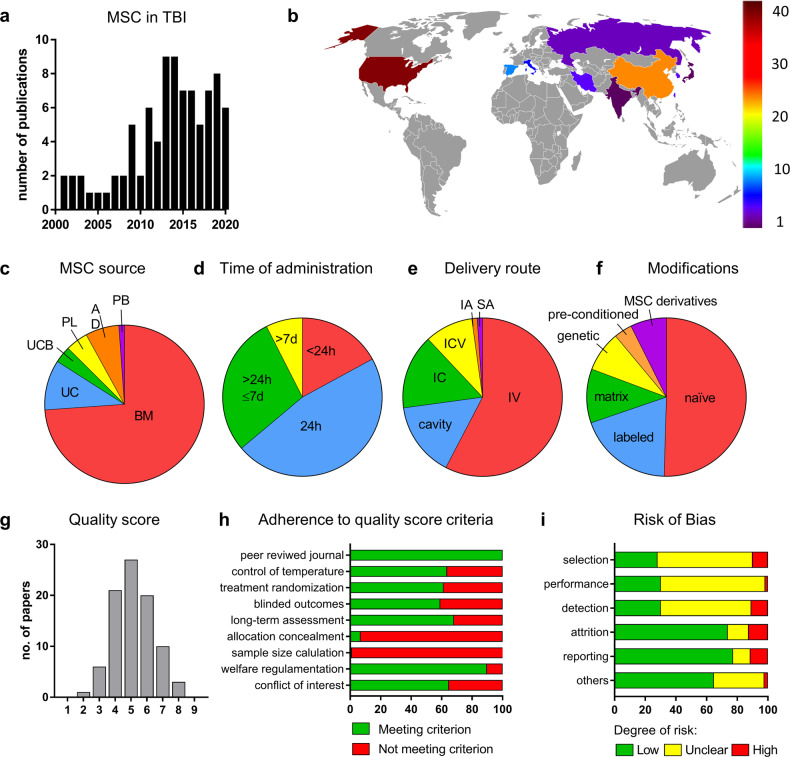
Fig. 2. Characteristics of the 88 studies in the qualitative synthesis, quality score, and risk of bias.
a Number of publications per year. b World map with a color scale indicating the number of papers published in each country (image adapted from Freepik.com). c–f Pie charts of features of publications related to MSC source (c), time of administration (d), delivery route (e), and modifications (f). g Distribution of quality scores. h Percentages of studies meeting each quality score criterion. i Risk of bias: percentages of low risk (green), unclear risk (yellow), and high risk (red) for each category.

