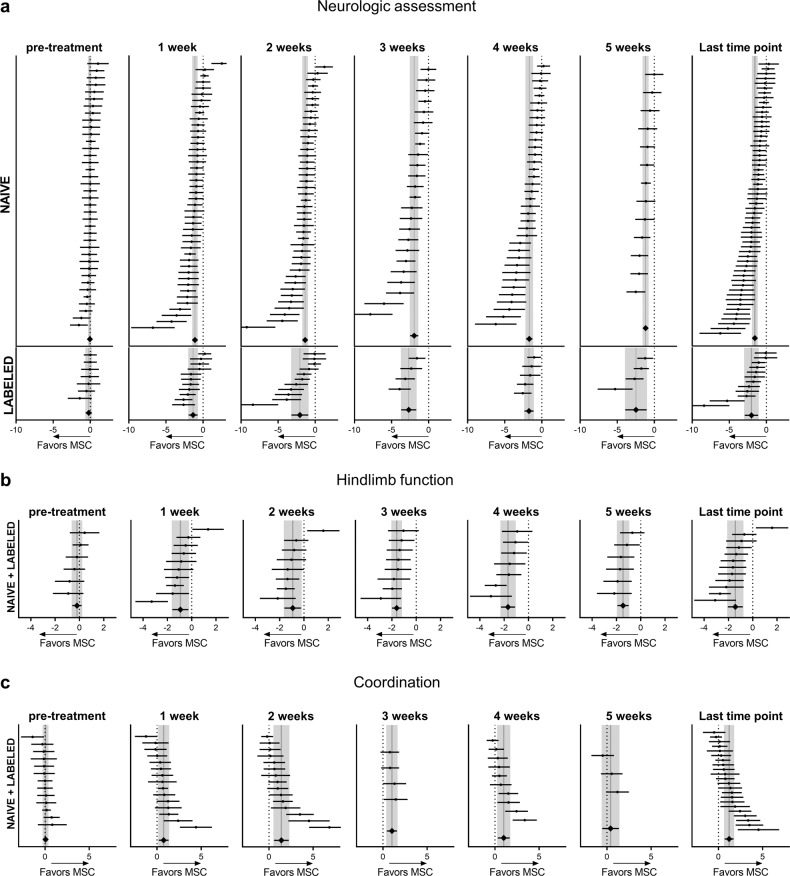
Fig. 3. Sensorimotor outcome assessment up to 5 weeks post-treatment.
Forest plots show mean effect size and 95% CI of naïve and labeled MSCs for neurologic assessments (a), hindlimb function (b), and coordination (c) up to 5 weeks post-treatment. The graph on the right shows the last time point (up to 5 weeks) for all studies. Dots represent the single studies, and diamonds indicate pooled data. Vertical gray bars represent the mean and 95% CI of the pooled estimated effect size.

