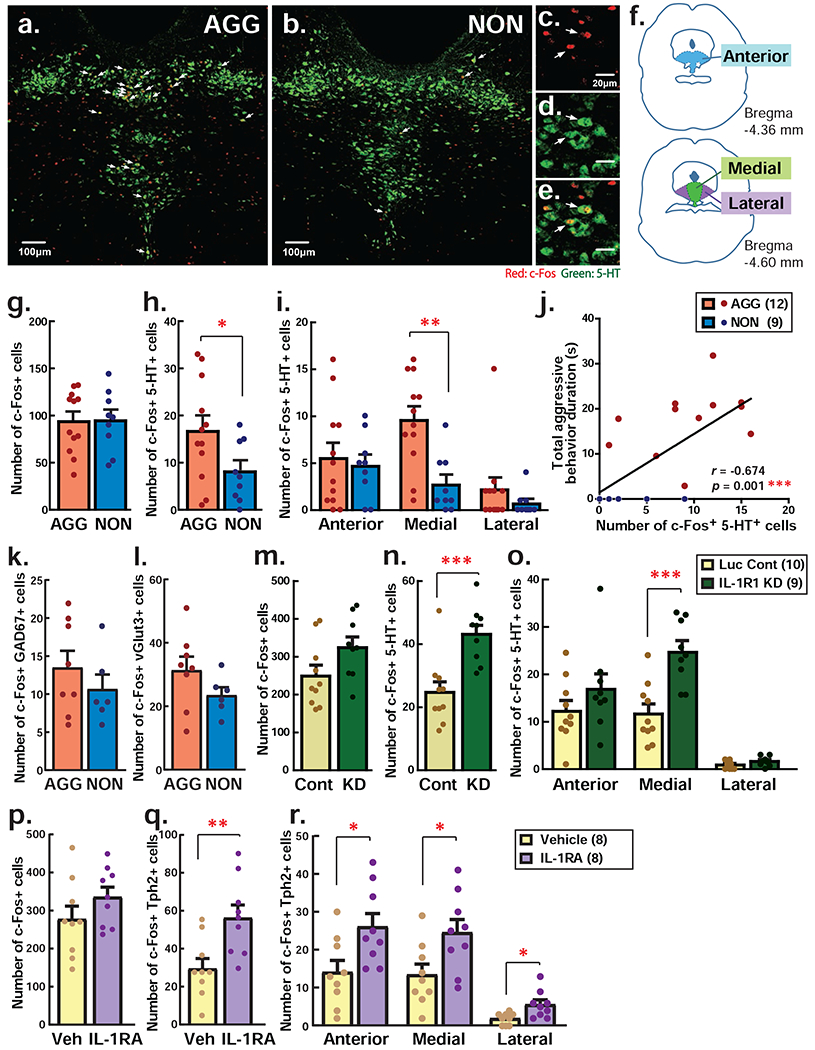
Figure 5. Individual difference and the effect of IL-1R1 KD in the aggressive encounter-induced activation of serotonin (5-HT) neurons in the DRN.

a-j c-Fos expression analysis in AGG and NON male mice by immunohistochemistry. Representative picture of the expression of 5-HT (green) and c-Fos (red) in the DRN in AGG (a) and NON (b) individuals. c-e Enlarged picture of a representative picture of the DRN showing c-Fos (c), 5-HT (d) and their co-localization (e). White arrows indicate activated 5-HT neurons that co-express both 5-HT and c-Fos protein. f Schematics of brain atlas for anterior, medial, and lateral subregions of the DRN where c-Fos and 5-HT expression was examined in this study. g-h Total number of c-Fos positive cells (g) and c-Fos expressing 5-HT neurons (h) in the DRN of AGG an NON animals. i Number of c-Fos expressing 5-HT neurons in each subregion of the DRN. j Positive correlation was observed between the number of c-Fos positive 5-HT neurons in the medial subregion of the DRN and total duration of aggressive behaviors. k-l Total number of c-Fos expressing GAD67-positive GABA neurons (k) and c-Fos expressing vGlut3-positive glutamatergic neurons (l) in the DRN of AGG an NON animals by RNAscope analysis. m-o c-Fos expression analysis in IL-1R1 KD and Luc control animals. Total number of c-Fos positive cells (m) and c-Fos expressing 5-HT neurons (n) in the DRN and each subregion of the DRN (o). p-r c-Fos expression analysis in i.c.v. IL-1RA injection and vehicle (Veh) injection control animals. Total number of c-Fos positive cells (p) and c-Fos expressing Tph2-positive 5-HT neurons (q) in the DRN and each subregion of the DRN (r). *p<0.05, **p<0.01. ***p<0.001.
