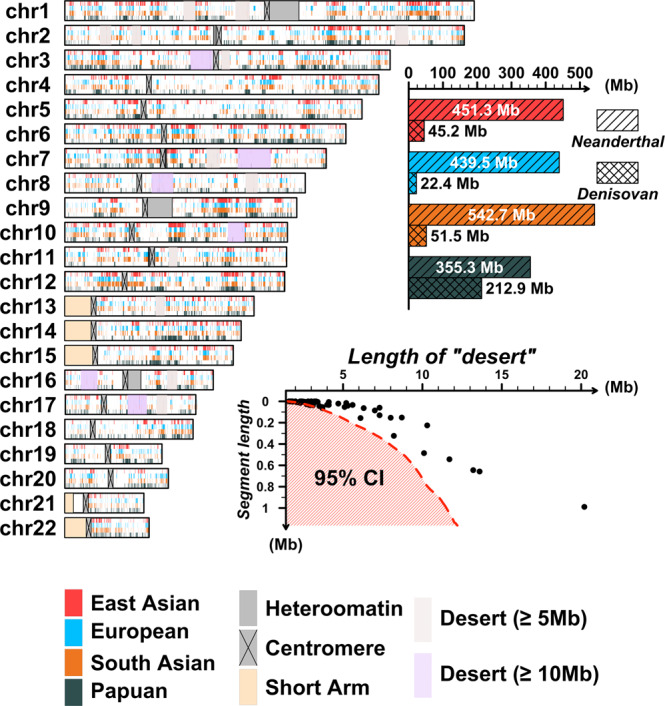
Fig. 2. The landscape of archaic introgression in non-Africans.

This figure demonstrates the genomic coverage of archaic introgression in four different continental/regional populations. To eliminate the influence of sample size, we set a minimal introgression frequency threshold of each position as 0.02. Regions with introgression frequency greater than 0.02 were defined as introgression-covered regions. We plotted the introgression-covered regions on the genome, where four different colors stand for the four different continental/regional populations, respectively. Red stands for East Asian populations; light blue stands for European populations; orange stands for South Asian populations; and dark blue stands for the Papuan population. The boxplot shows the total introgression-covered length of Neanderthal and Denisovan ancestry for the four different populations. We also performed a test of introgression “deserts.” We first divided the genome into thousands of 100-kb bins. Then, we obtained the empirical distribution of introgression-covered length. A two-tailed test was performed to find those genomic regions with extremely rare introgression segments. For the detailed statistical method, please refer to Supplementary Note 5. The red shadow indicates the 95% confidence interval and each black dot stands for one introgression “desert.” We also plotted the long “desert” on the genome with two different colors. Purple on the genome stands for “deserts” longer than 10 Mb, and brown stands for “deserts” longer than 5 Mb.
