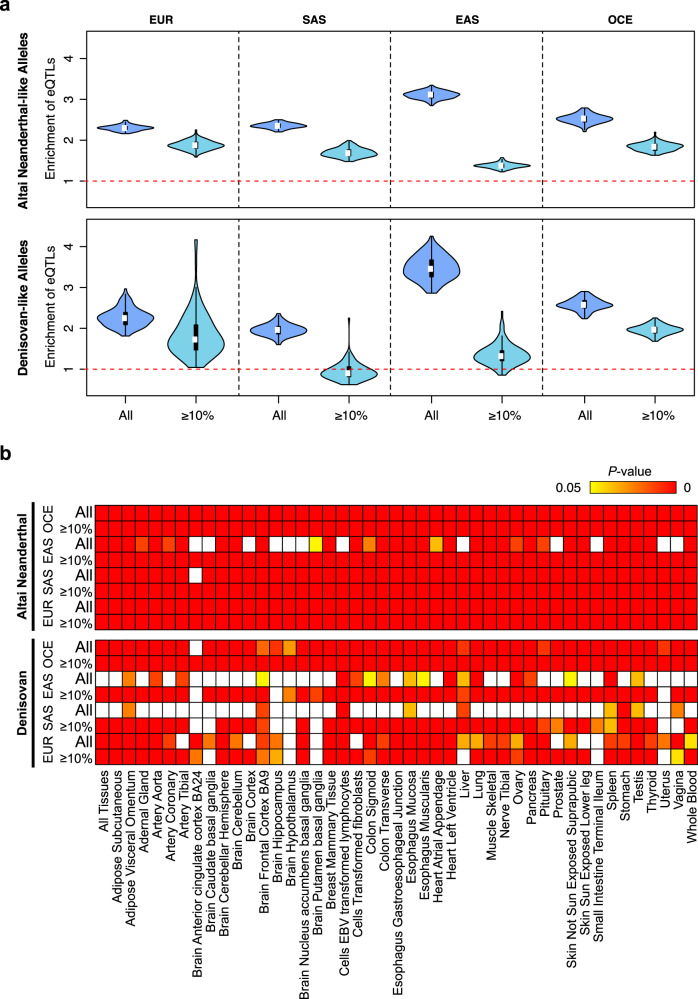
Fig. 7. Enrichment of the archaic-like alleles in variants associated with gene expression regulation.
a Enrichment of Neanderthal-like (upper panel) and Denisovan-like (lower panel) alleles in the pooled eQTLs of all tissues. Each violin plot shows the ratio between the number of eQTLs in the archaic loci and that in the frequency-matched non-archaic loci. Two subsets of loci were analyzed, including all archaic loci (dark blue) and those with archaic allele frequency ≥10% (light blue). The white dot and the black bar in the center of each violin indicate median and interquartile range of the ratio, respectively. Whiskers are represented in the form of Tukey style. The red dashed line indicates ratio = 1. EUR European, SAS South Asian, EAS East Asian, OCE Oceanian. b Enrichment of the archaic-like alleles for eQTLs in each tissue. The Neanderthal-like alleles (upper panel) and the Denisovan-like alleles (lower panel) were analyzed independently. For each population group, two subsets of loci were analyzed, including all archaic loci and those with archaic allele frequency ≥10%. The yellow-to-red heatmap shows significant P values (P value <0.05 obtained by a one-sided empirical test and corrected using the Benjamini–Hochberg procedure accounting for all tissues; Exact P-values are shown in Supplementary Data 5), which means the proportions of eQTLs in the archaic-like alleles are significantly larger than those in the non-archaic-like alleles. In both plots, the EUR group consists of 503 European samples from CEU, FIN, GBR, IBS, and TSI; The SAS group includes 403 South Asian samples from GIH, ITU, STU, and PJL; The EAS group integrates 405 East Asian samples from CHB, CHS, JPT, and CDX; The OCE group is represented by 30 Papuan samples.

