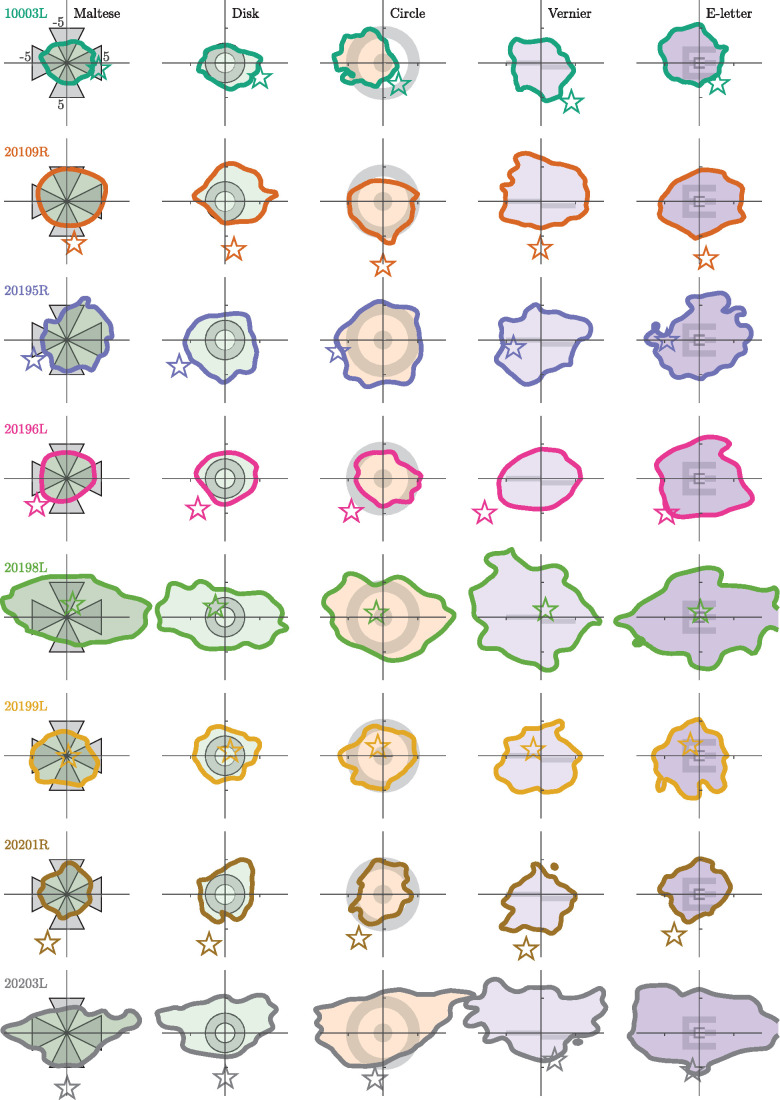
Figure 4.
The 68% isoline contours (ISOA) of the entire eye movement trace. Each row is a subject and each column is a fixation condition, the stimulus for which is drawn centered on each plot for reference. Position (0,0) on the plot corresponds with the PRL, or the peak of the fixation position distribution. Note that idiosyncrasies in the eye movement can cause this peak to appear displaced from the center of the isoline contour. The position of these distributions represent the location of the fixated image and are plotted in fundus view coordinates (same as Figure 1). The star in each plot indicates the relative location of the PCD. Axis units in the upper left plot are in minutes of arc.

