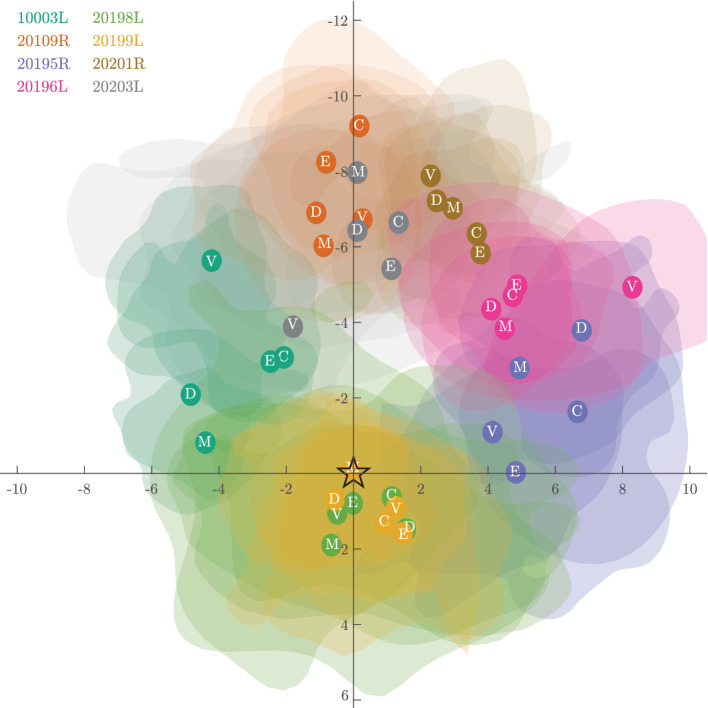
Figure 5.
Individual PRL locations plotted relative to their PCD centered to (0,0). Location of the PRLs are shown as opaque circles overlaid onto the transparent isoline contours with the condition defined in white text within the center. This figure highlights that each subject's PRL tends to fall off their respective PCDs. However, the various PRLs defined in each condition all group together closely. To enhance visibility, the isoline contours here encompass only 38% (0.5 SD) of the fixation trace instead of the 68% (1 SD). Axis units are in minutes of arc.

